
Execution Monitor
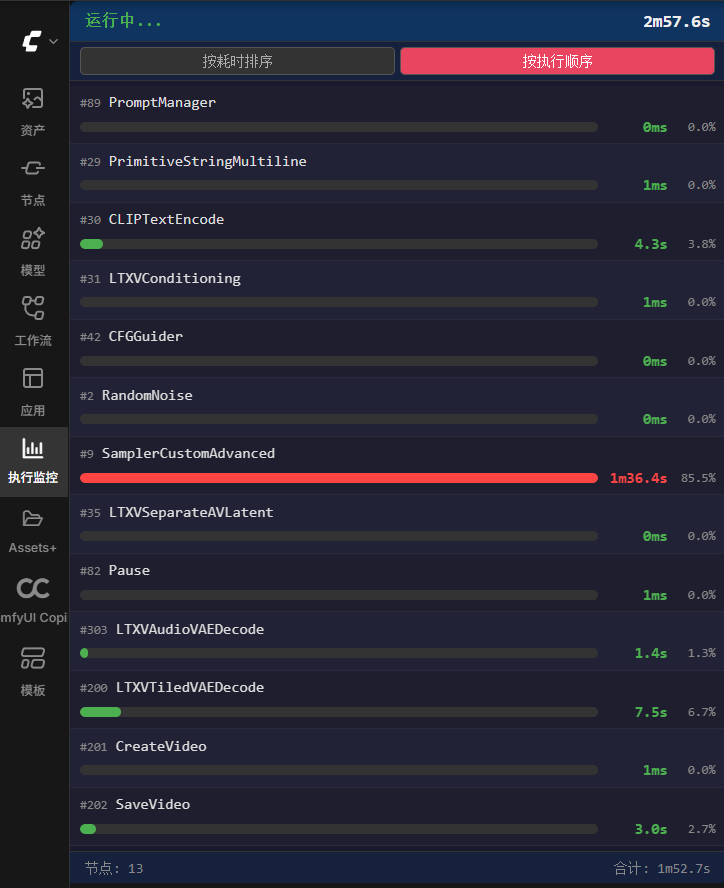
Real-time node execution timing panel for ComfyUI. Displays per-node duration, progress bars, heat-map coloring, and total execution time in the sidebar.
ComfyUI Execution Monitor
A real-time node execution timing panel for ComfyUI. Displays per-node duration, progress bars, and total execution time in a sidebar panel.
Features
- Real-time tracking — See which node is currently running and how long it's taking
- Heat-map coloring — Nodes are color-coded by relative duration (green → yellow → orange → red)
- Sort modes — Sort by duration (find bottlenecks) or execution order (follow the flow)
- Live elapsed timer — Running clock during execution
- Two operating modes:
- Enhanced mode (with ComfyUI-Enhancement-Utils): Precise per-node timing from profiler hooks
- Standalone mode (no dependencies): Uses built-in ComfyUI events for wall-clock measurement
- Sidebar integration — Registers as a native ComfyUI sidebar tab (click the bar chart icon)
- Persists last results — View timing from the previous execution even after navigating away
- i18n — Auto-detects Chinese/English locale
Installation
ComfyUI Manager (Recommended)
Search for "Execution Monitor" in the ComfyUI Manager and install.
Manual Installation
cd ComfyUI/custom_nodes
git clone https://github.com/thisrey/ComfyUI-ExecutionMonitor.git
Restart ComfyUI after installation.
Usage
- Click the bar chart icon (📊) in the left sidebar
- Run any workflow — the panel updates in real-time
- Use the sort buttons to switch between By Duration and By Order
- After execution completes, results remain visible for analysis
Optional: Enhanced Timing
For more accurate per-node timing, install ComfyUI-Enhancement-Utils. The monitor will automatically detect and use its profiler hooks. Without it, the monitor still works using ComfyUI's built-in execution events.
Requirements
- ComfyUI (any recent version with sidebar API support)
- No Python dependencies required — this is a pure frontend extension
License
MIT — see LICENSE
ComfyUI 执行监控面板
ComfyUI 实时节点执行耗时面板。在侧边栏中显示每个节点的运行时长、进度条和总执行时间。
功能
- 实时追踪 — 显示当前正在运行的节点及其耗时
- 热力图配色 — 按相对耗时着色(绿 → 黄 → 橙 → 红)
- 排序模式 — 按耗时排序(找瓶颈)或按执行顺序排序(跟踪流程)
- 实时计时器 — 执行期间显示运行中的时钟
- 双模式运行:
- 增强模式(安装了 Enhancement-Utils):精确的逐节点计时
- 独立模式(无依赖):使用 ComfyUI 内置事件测量时间
- 侧边栏集成 — 注册为原生 ComfyUI 侧边栏标签页
- 保留上次结果 — 切换面板后仍可查看上次执行的计时数据
- 国际化 — 自动检测中英文环境
安装
通过 ComfyUI Manager(推荐)
在 ComfyUI Manager 中搜索 "Execution Monitor" 安装。
手动安装
cd ComfyUI/custom_nodes
git clone https://github.com/thisrey/ComfyUI-ExecutionMonitor.git
安装后重启 ComfyUI。
使用方法
- 点击左侧边栏的 柱状图图标(📊)
- 运行任意工作流 — 面板实时更新
- 使用排序按钮切换 按耗时 和 按顺序
可选:增强计时精度
安装 ComfyUI-Enhancement-Utils 可获得更精确的逐节点计时。未安装时,监控面板仍可正常工作。
依赖
- ComfyUI(支持侧边栏 API 的任意近期版本)
- 无需 Python 依赖 — 纯前端扩展