
ComfyUI-3D-RGB-Histogram
A ComfyUI custom node that renders an interactive 3D RGB color histogram of an image directly on the node, using Three.js.
Nodes (1)
ComfyUI 3D RGB Histogram
A ComfyUI custom node that renders an interactive 3D RGB color histogram of an image directly on the node, using Three.js.
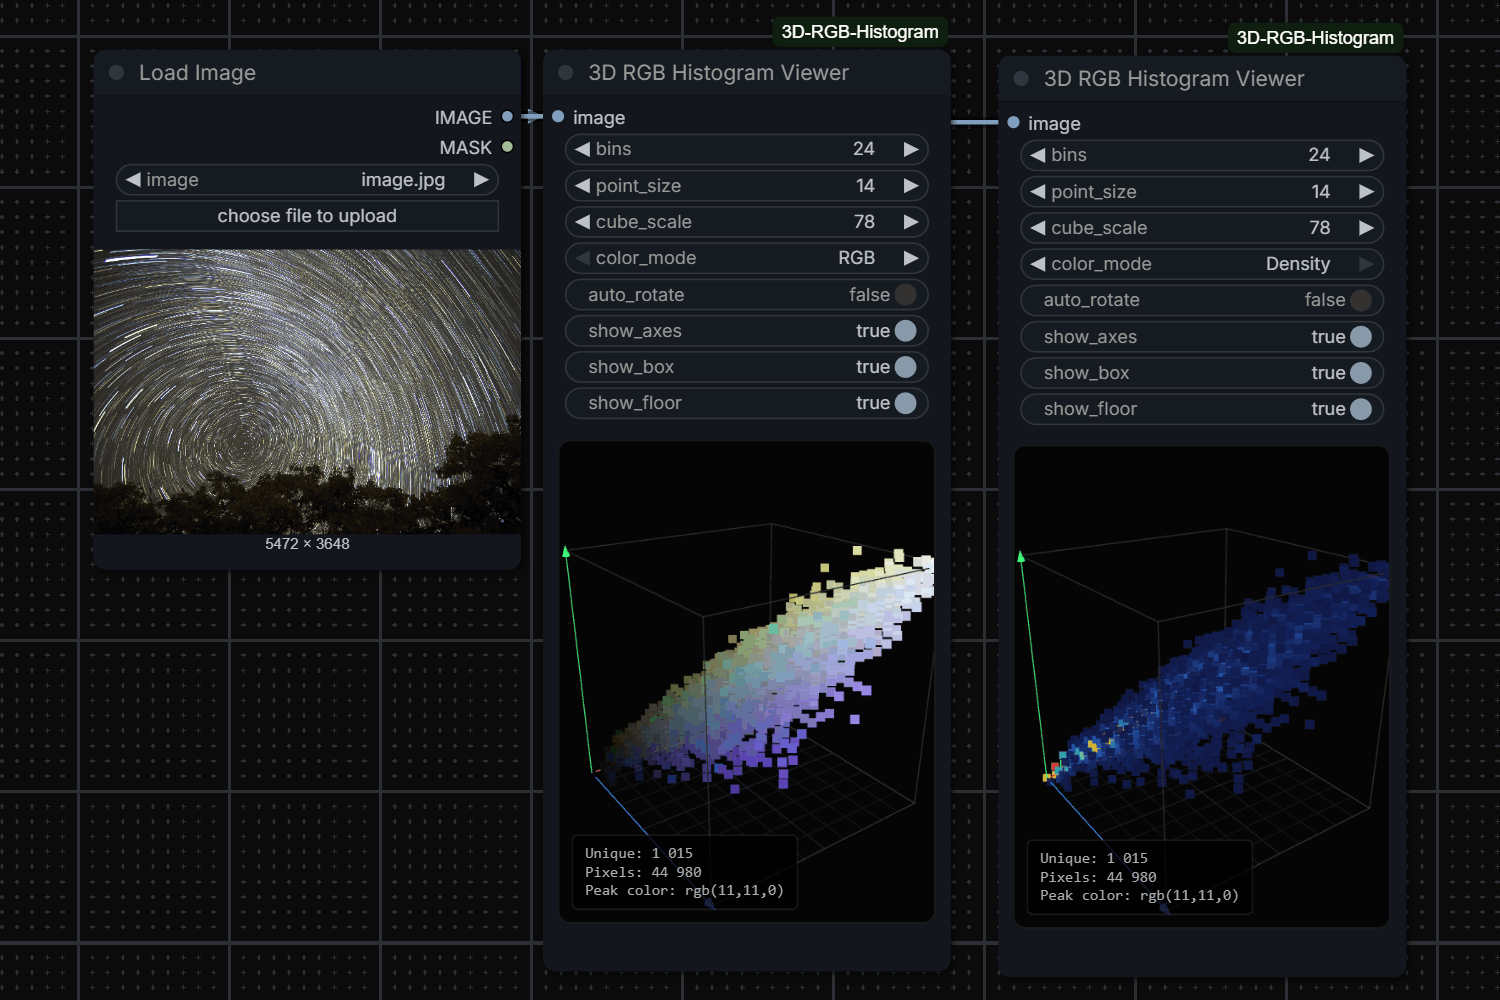
Each point in the cube represents a color bucket; its position encodes the R/G/B values, and its color shows either the actual RGB color or the bucket frequency (density).
Features
- Interactive 3D histogram rendered on the node
- Orbit and zoom the cube directly with the mouse
- Toggle axis, bounding box, and floor grid overlays
- Switch between
RGBandDensitycoloring modes - Works fully offline with bundled Three.js
Installation
Manual
- Clone this repository into your
ComfyUI/custom_nodes/folder:cd ComfyUI/custom_nodes git clone https://github.com/petrvavrin/ComfyUI-3D-RGB-Histogram.git - Install the Python dependencies:
python_embeded\python.exe -m pip install -r ComfyUI\custom_nodes\ComfyUI-3D-RGB-Histogram\requirements.txt - Restart ComfyUI.
The node ships with a vendored copy of Three.js (r128) under web/lib/, so
it works fully offline as long as that file is present.
Usage
Add the 3D RGB Histogram Viewer node (category image/analysis) and
connect an IMAGE output to it. The node has no outputs of its own; it
renders an interactive preview widget directly on the node.
Controls:
- Drag with the mouse to orbit the cube
- Scroll to zoom in/out
Parameters:
| Parameter | Default | Description |
|---|---|---|
| bins | 24 | Number of buckets per color channel (higher = more detail, slower) |
| point_size | 14 | Size of each point in the cube |
| cube_scale | 78 | Overall scale of the histogram cube |
| color_mode | RGB | RGB colors points by their actual color; Density colors by how frequently that color appears |
| auto_rotate | False | Slowly spin the cube automatically |
| show_axes | True | Show the R/G/B axis indicators |
| show_box | True | Show the bounding box edges |
| show_floor | True | Show the floor grid |
Notes
- Only the first image of a batch is visualized.
- Preview images are written to ComfyUI's temp directory as
rgb_histogram_3d_temp_<node_id>.png. - Each node overwrites its own file on every run, so files do not pile up during a session.
- Leftover files from a previous session are cleaned up when ComfyUI starts.
Troubleshooting
- If the node does not appear after installation, restart ComfyUI.
- Verify the repository is installed under
ComfyUI/custom_nodes/. - If the histogram does not render, ensure the connected input is a valid
IMAGEoutput.
License
MIT.
Bundled Three.js (web/lib/three.min.js, r128) is also MIT-licensed,
© Three.js Authors.