
ComfyUI-Vitals
A lightweight resource monitor for ComfyUI with CPU, RAM, NVIDIA GPU, VRAM and temperature readings.
ComfyUI-Vitals - Resource monitor for ComfyUI
A lightweight resource monitor for ComfyUI with CPU, RAM, NVIDIA GPU, VRAM and temperature readings. View usage in the sidebar or detach a compact, movable bar while working on your workflow. No workflow nodes or connections are required.
Features
- CPU model, physical core and logical processor counts in the sidebar.
- CPU and RAM usage, plus utilization, VRAM and temperature for each NVIDIA GPU.
- Shaded history graphs with a latest-reading marker and subtle guides.
- Usage colors: teal below 70%, amber from 70% to below 90%, and coral at 90% or above.
- Automatic detection of multiple NVIDIA GPUs, with an All GPUs / individual GPU display filter.
- Detachable bar with a visible move handle, keyboard movement and automatic docking back into the sidebar.
- Refresh intervals of 1, 2 or 5 seconds, plus Pause and Resume.
- Sampling stops when the monitor is closed, paused or in a hidden browser tab.
- No chart libraries, sampling subprocesses, CUDA allocations or outbound requests.
Preview
Sidebar
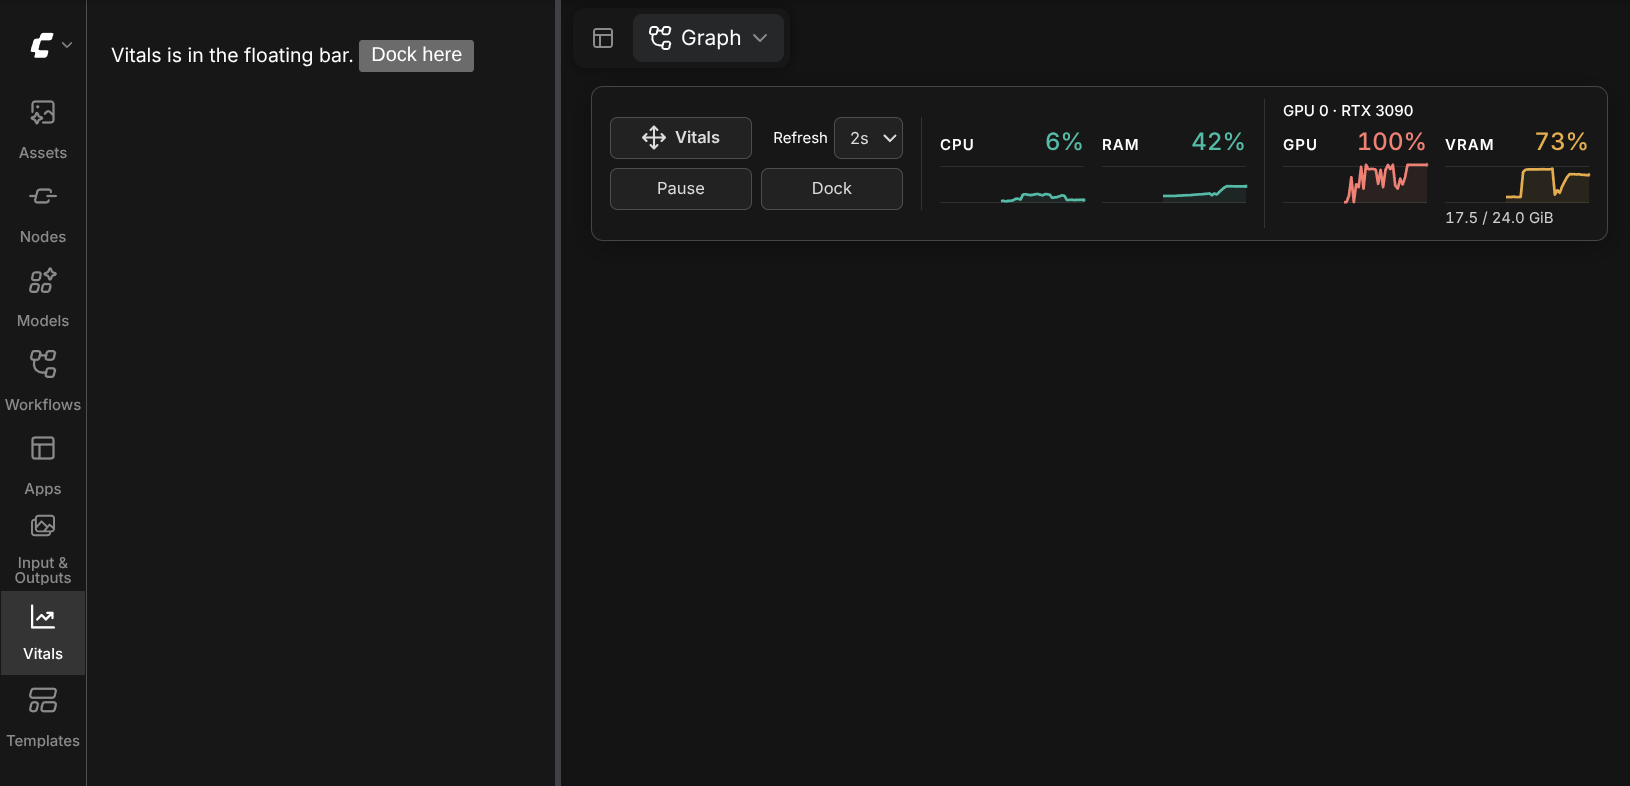
<img src="preview_sidepanel.png" alt="Vitals sidebar showing CPU details, RAM, GPU utilization and VRAM history graphs" width="420">Detached bar
Requirements
- A working ComfyUI installation with the custom-sidebar extension API.
- Python 3.10 or newer, subject to your ComfyUI version's own requirements.
psutil>=5.9.8for CPU and RAM readings; ComfyUI already requires psutil.nvidia-ml-py>=12.560.30and a working NVIDIA driver for NVIDIA GPU readings.aiohttp, supplied by ComfyUI, for the local resource endpoint.
CPU and RAM monitoring work without NVIDIA hardware. AMD, Intel, Apple GPU and
MIG-specific monitoring are not implemented. An unavailable GPU sensor shows
N/A without hiding other available readings. A device that cannot be enumerated
does not prevent detection of other GPUs.
Installation
Manual install
Place the package in your ComfyUI installation with this structure:
ComfyUI/
└── custom_nodes/
    └── ComfyUI_Vitals/
        ├── __init__.py
        ├── collector.py
        ├── service.py
        ├── requirements.txt
        └── js/
From the ComfyUI directory, install dependencies using the same Python environment that runs ComfyUI:
python -m pip install -r custom_nodes/ComfyUI_Vitals/requirements.txt
For ComfyUI Windows portable, run this from the portable installation's root directory instead:
.\python_embeded\python.exe -m pip install -r .\ComfyUI\custom_nodes\ComfyUI_Vitals\requirements.txt
Restart ComfyUI, refresh the browser, and select Vitals in the left sidebar. There is no node to search for in the Add Node menu.
ComfyUI Manager
Use the manual installation instructions above. Manager and registry installation have not been verified.
Usage
| Control | Behaviour | |---|---| | Refresh | Choose 1, 2 or 5 seconds. Default: 2 seconds. | | Pause / Resume | Stop or restart resource updates. | | Detach | Move the monitor into a compact floating bar. | | Move icon / Vitals label | Drag the bar. With the handle focused, use arrow keys; hold Shift to move farther. | | Dock | Open the Vitals sidebar automatically and return the bar to it. | | Dock here | Return the floating bar to an already open Vitals sidebar. | | GPU | Show all detected NVIDIA GPUs or one device. Appears only with multiple GPUs. |
Use Dock to return the floating bar to the sidebar, then close the sidebar to dismiss the monitor. Pause stops updates without dismissing it.
The floating bar uses compact rows of controls beside the graphs, with an extra
GPU selector row when multiple devices are detected.
The floating bar keeps updating when the sidebar closes. On narrow screens or
with many GPUs, it scrolls horizontally; selecting one GPU reduces its width.
The floating bar groups GPU usage and VRAM beneath a shared short device name,
with the full name in its tooltip. Used/total VRAM remains visible below its
graph in compact mode, for example 12.0 / 24.0 GiB.
Hover over a metric for its memory or temperature detail. VRAM details include
available memory, calculated from the existing total and used readings.
Graphs hold up to 60 samples on a fixed 0 to 100% scale, with the newest reading on the right. The whole trace uses the current reading's color. High GPU usage during generation is normal; these colors indicate utilization, not faults or temperature warnings.
History is preserved when docking, detaching or switching browser tabs. Hidden tabs stop polling; returning resumes updates with a break in the trace to mark the unsampled period. The break does not represent its duration. Pause, request errors, closing the monitor and refresh interval changes reset history.
Refresh interval, GPU selection and floating position are saved locally in your browser. Restored positions stay within the viewport. History and open/closed state are not saved. Top docking is not included.
Understanding the readings
- CPU and RAM: system-wide usage on the ComfyUI server, including other apps.
- RAM used: total minus available memory, treating reclaimable cache as available.
- GPU and VRAM: system-wide readings for each physical NVIDIA GPU visible to NVML. The GPU selector does not change ComfyUI's execution device. NVML indices are not necessarily CUDA device indices.
- Memory units: GiB. Temperature is shown in degrees Celsius.
- N/A: unavailable sensor or CPU baseline warmup. CPU can show N/A on the first sample and after a long pause.
- Pause / Resume: the button indicates whether updates are manually paused. Dimmed readings are stale while paused, hidden, waiting for data or offline. Request errors appear in the Pause button tooltip.
GPU detection runs on the first sample. Restart ComfyUI after changing drivers or available GPUs.
CPU identity and core counts are detected once, on first demand. Linux reads
/proc/cpuinfo; Windows reads the processor name from the registry. Other
platforms show architecture and available counts when the model is unavailable.
The detached bar keeps CPU details in the metric tooltip.
Resource use
One worker collects readings on demand. A shared one-second cache combines requests from multiple clients. There is no background sampling loop, and history is kept only in the browser. An in-flight driver query may finish after the monitor closes.
The read-only /vitals/stats endpoint uses the ComfyUI server's access controls.
Clients that can access it can read system-wide resource metrics.
Compatibility
Tested on ComfyUI 0.35.0, frontend 1.52.7, Python 3.12.12, Linux and an NVIDIA RTX 3090. Multiple-GPU display and partial sensor failures were tested with simulated devices; physical multi-GPU hardware remains unverified.
The package uses V3 extension registration on supported backends and a V1 fallback on older backends. It registers no executable workflow nodes. The V3 path was runtime-tested; the V1 path has simulated import tests only. Older frontends, Windows and macOS have not been runtime-tested.
Troubleshooting
- Vitals is missing: restart ComfyUI, check its startup log for import errors, then hard-refresh the browser with Ctrl+Shift+R.
- GPU readings are missing: install requirements in ComfyUI's Python environment and confirm the NVIDIA driver works. Restart ComfyUI afterwards.
- Readings stay dimmed: select Resume if paused. Otherwise, hover over Pause for a request error, confirm ComfyUI is running and inspect its log.
- Old controls remain after an update: hard-refresh the browser.
To uninstall, remove the ComfyUI_Vitals folder from custom_nodes and restart
ComfyUI. If you installed using a symlink, remove only that symlink.
Development
From the package directory:
python -m unittest discover -s tests -v
node --input-type=module --check < js/vitals.js
Tests require psutil and aiohttp. ComfyUI and NVIDIA hardware are not required for the unit tests. Node.js is needed only for the JavaScript syntax check.
The optional browser regression uses Playwright against an isolated running
ComfyUI server. Install Playwright in your test environment, then run
python tests/browser_visibility.py. Set VITALS_TEST_URL (default
http://127.0.0.1:8189) and CHROME_PATH to your test server and Chrome
executable. It simulates visibility changes in the actual frontend and verifies
history, polling suspension and resume gaps in both display modes.
Support
If you find this useful, please consider starring the repo. Stars help other people discover these nodes.