
ComfyUI Watcher
Progress nodes for your ComfyUI canvas: step, speed, time running, time left and VRAM, in a node you park in the corner of your graph.
ComfyUI Watcher
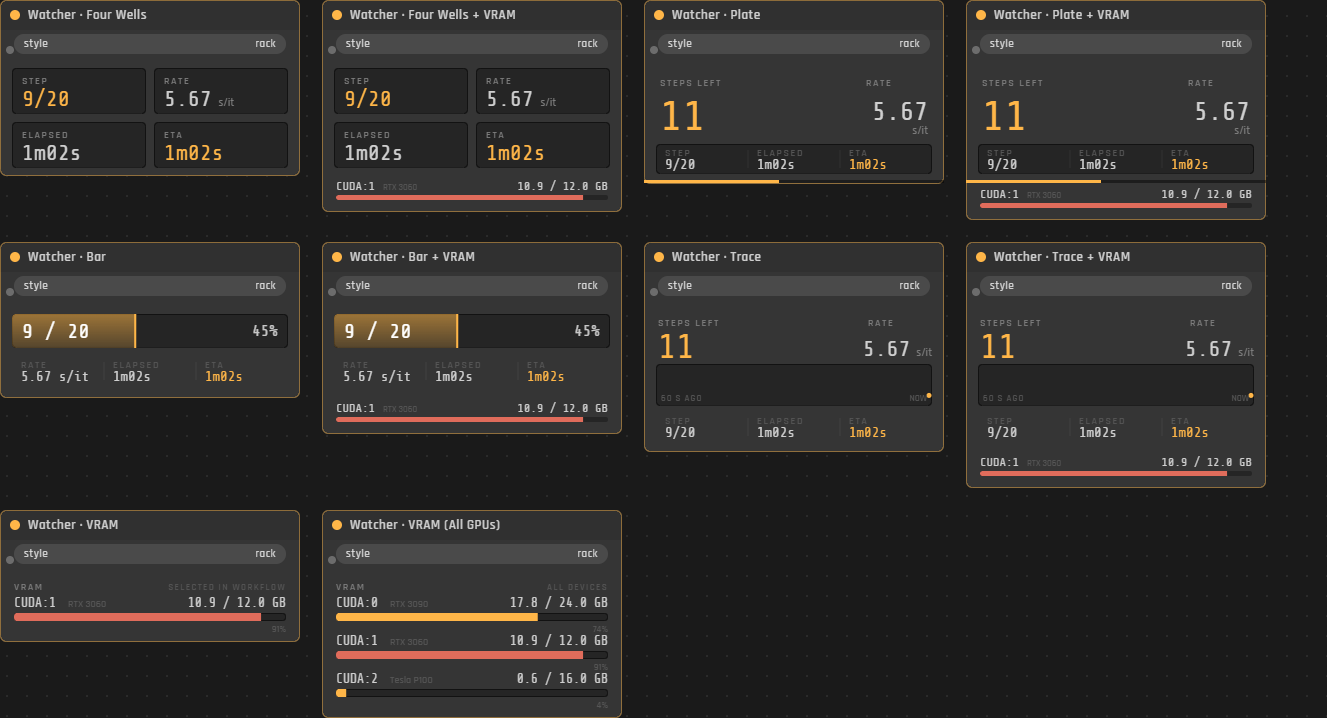
Nodes that sit on your canvas and tell you how the current run is going: what step it's on, how fast it's going, how long it's been running, and when it'll be done. Plus VRAM, if you want it.
I built these because I kept scrolling around looking for the progress bar on the node that was running, and because the number I actually care about is "how much longer", which ComfyUI doesn't tell you anywhere. Now it's parked in the corner of my graph where I can see it.
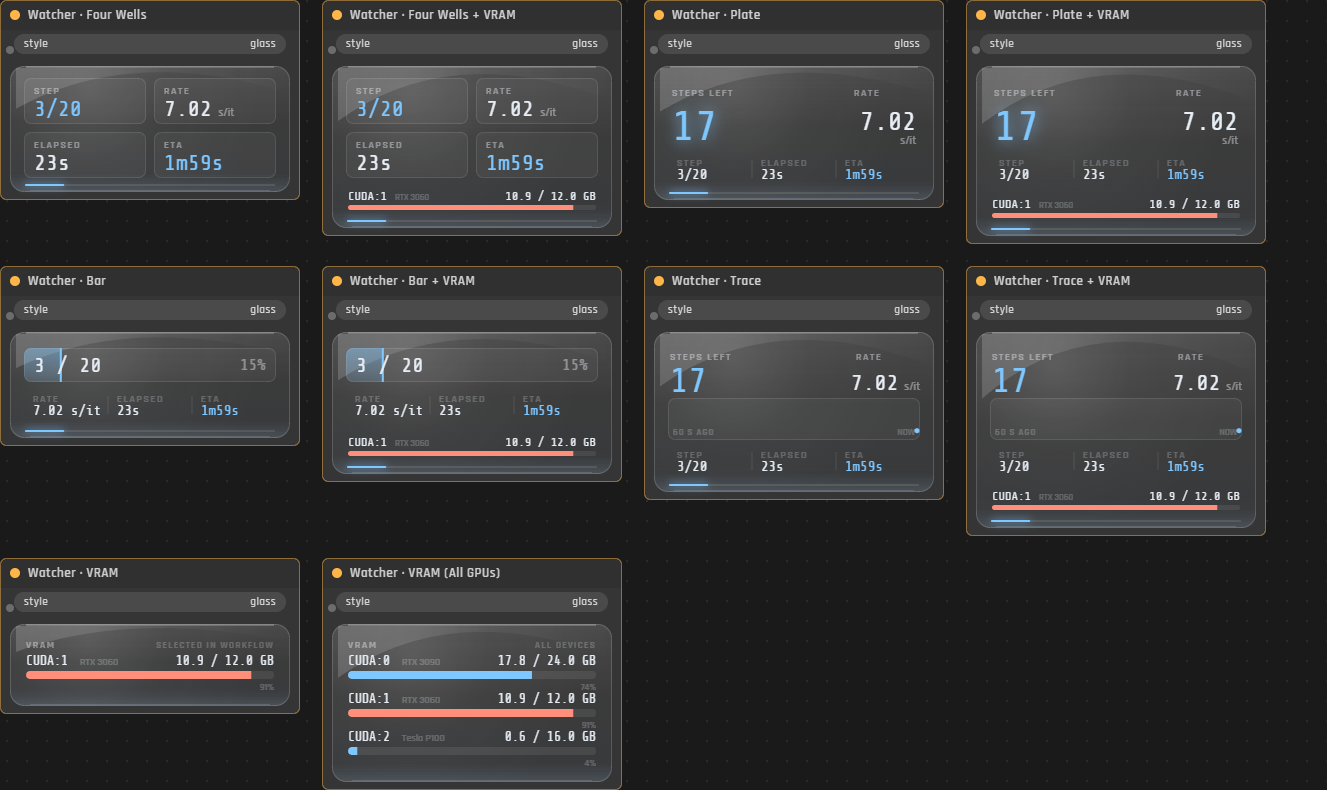
Same nodes, glass style:
What you get
Ten nodes, under Add Node → ComfyUI Watcher:
- Four Wells — step, rate, elapsed, ETA in four boxes.
- Plate — big steps-remaining number, everything else smaller underneath.
- Bar — the node is basically one big progress bar. Shortest of the lot.
- Trace — same numbers plus the last 60 seconds of speed as a little graph, so you can see it slowing down or speeding up.
- Each of those four again as + VRAM, which adds a VRAM row at the bottom.
- VRAM on its own, if that's all you want — just the card(s) this workflow uses.
- VRAM (All GPUs) — every card in the box, whatever the workflow is doing. Handy when something else is hogging a GPU.
All four job layouts also carry a NODE line: which node of the run is going right now, and how
far through the graph that is — 4/21 KSampler. The step count only tells you how far into one
node you are, and a graph spends most of its time loading, encoding and decoding either side of the
sampler. If nothing has run yet it shows a dash; if the workflow size isn't known it shows the
position on its own rather than inventing a total.
Every node has a style dropdown on it: rack or glass. It's a widget, not a separate node,
so you can flip it without deleting anything and it saves with your workflow.
They don't do anything to your graph. No inputs, no outputs, they never execute. Drop one anywhere.
Install
ComfyUI Manager
Search "ComfyUI Watcher".
comfy-cli
comfy node install comfyui-watcher
Git
cd ComfyUI/custom_nodes
git clone https://github.com/an80sPWNstar/ComfyUI-Watcher comfyui-watcher
Windows portable: ComfyUI_windows_portable\ComfyUI\custom_nodes\
Desktop app: whatever base folder you picked at setup, then ComfyUI\custom_nodes\
Linux: ~/ComfyUI/custom_nodes/
Then restart ComfyUI — not just a browser refresh. There is nothing else to install. In the log you should see:
ComfyUI Watcher progress relay installed (broadcasting watcher.* events)
Adding one to your graph
Right-click an empty spot on the canvas → Add Node → ComfyUI Watcher → pick one.
<img src="images/howto-menu.png" width="420" alt="Right-click menu: Add Node, ComfyUI Watcher">Or double-click an empty spot and type watcher:
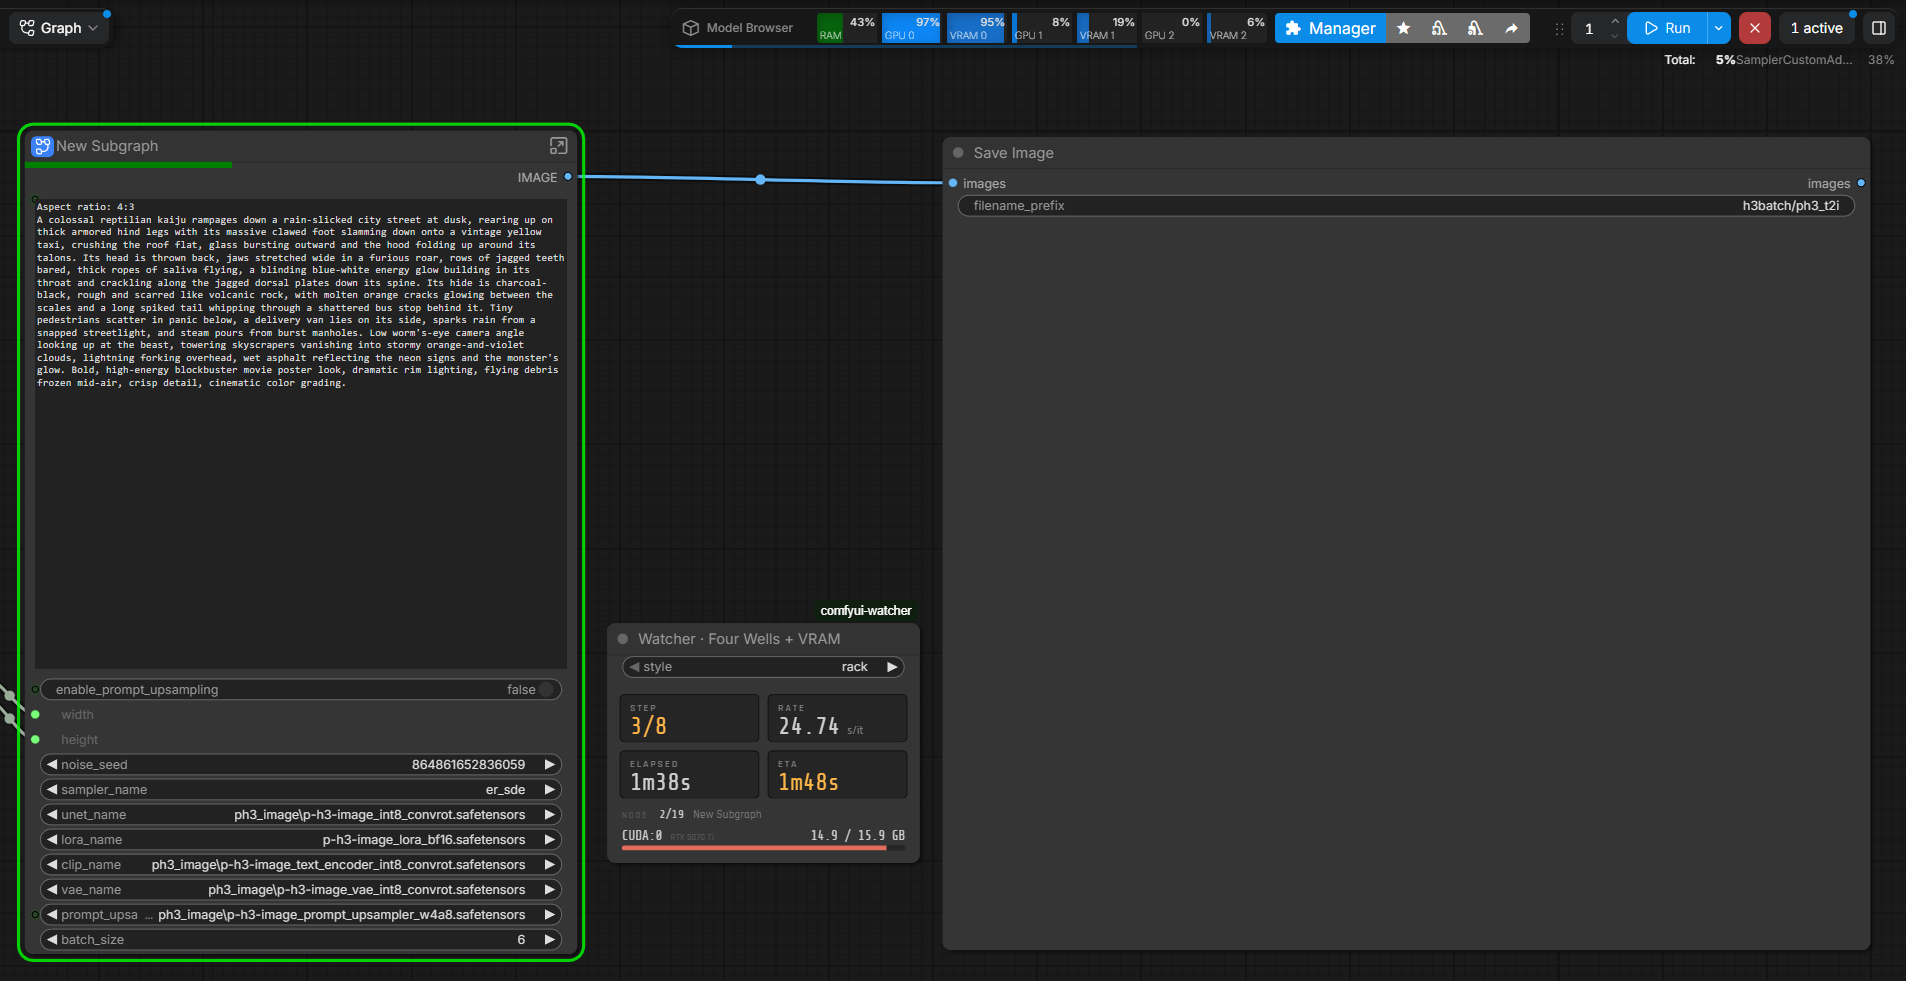
Put it anywhere. There are no wires to connect. Here it's sitting next to Save Image during a run:
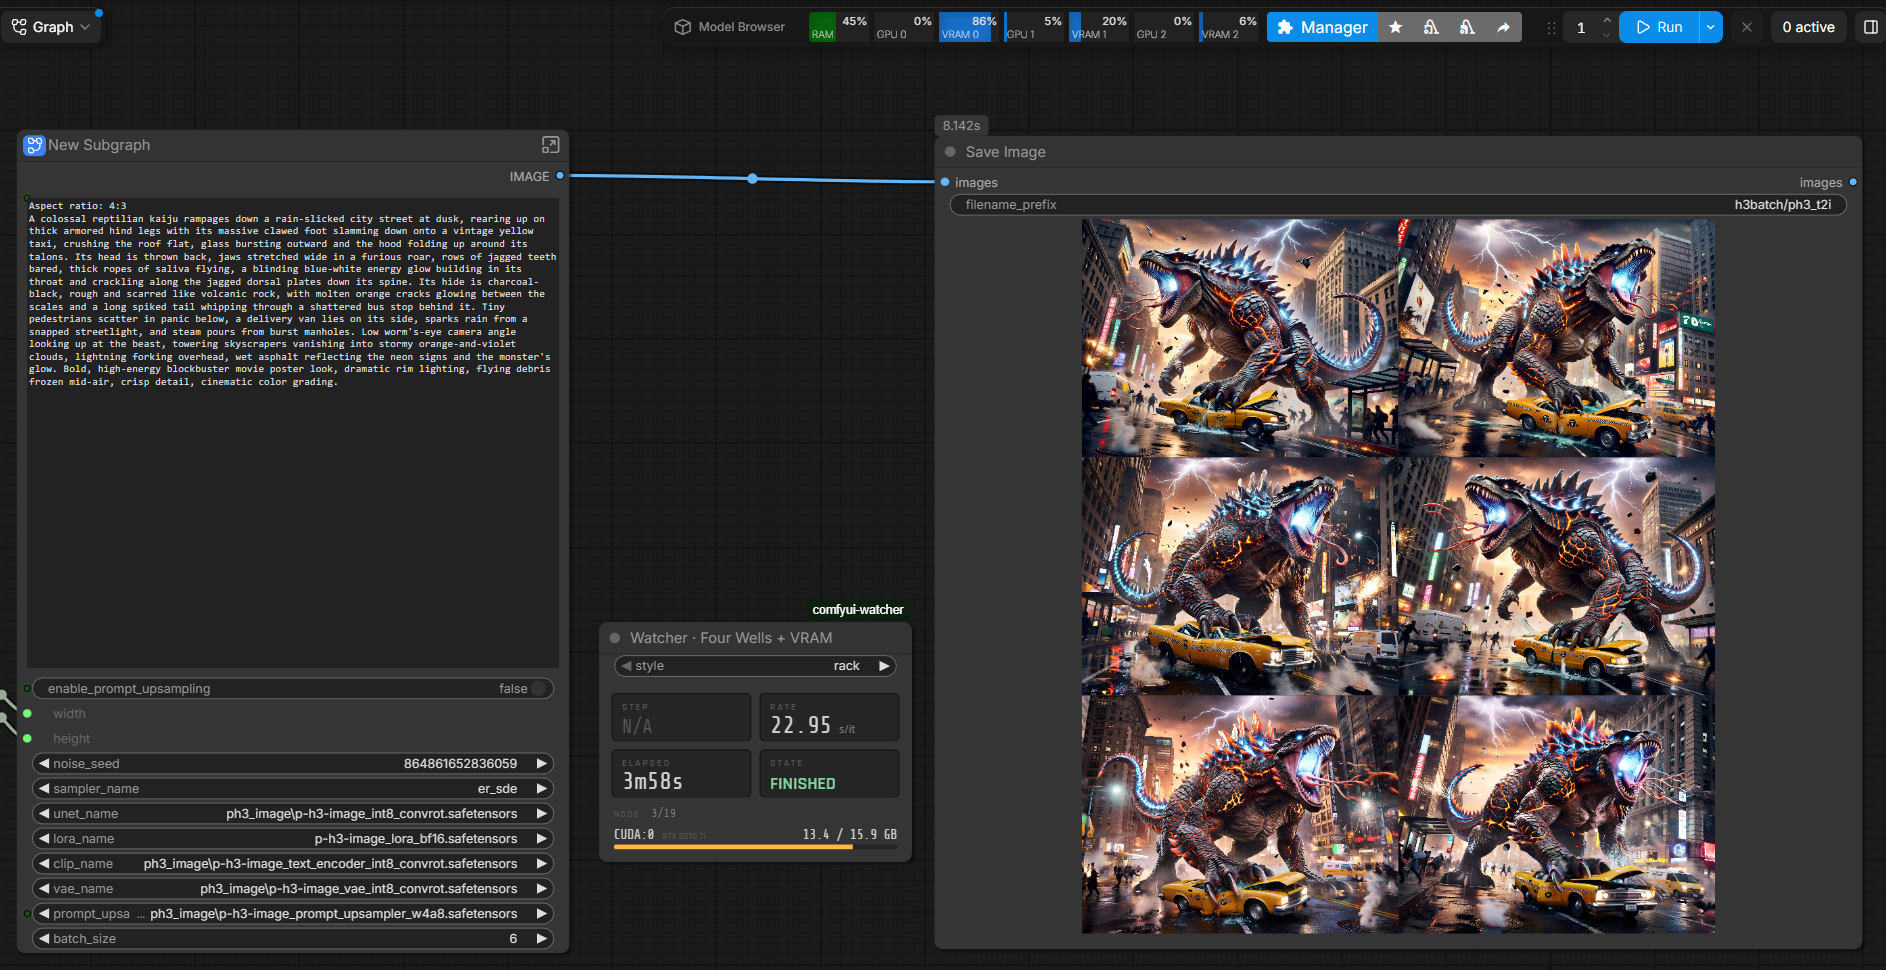
When the run is done it says FINISHED and keeps the total time and the last speed:
To change the look, click style on the node and pick rack or glass:
If you'd rather not use git
Green Code button → Download ZIP, unzip, put the folder in custom_nodes and rename it to comfyui-watcher. You want
to end up with:
ComfyUI/custom_nodes/comfyui-watcher/
    __init__.py
    README.md
    web/
If the nodes don't show up, it's almost always that the folder is nested one level too deep —
custom_nodes/ComfyUI-Watcher-main/ComfyUI-Watcher-main/ is the usual one after unzipping.
The __init__.py has to be directly inside the folder that sits in custom_nodes.
The VRAM node only shows the GPU you're actually using
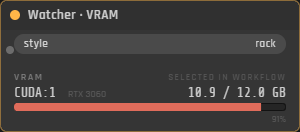
If you've got more than one card, ComfyUI knows about all of them, but your workflow is probably only using one. So:
- If a node in your graph picks a device, you get those cards and nothing else. It reads both
kinds: ComfyUI's own Select Model / CLIP / VAE Device nodes (
gpu:0,gpu:1) and the ComfyUI-MultiGPU pack's (cuda:0,cuda:1). - MultiGPU CFG Split is handled too, which is a bit different: that node doesn't name a card,
it takes a count. So
max_gpus 2means it'll use your main card plus the next one, and that's what you get — two rows. - Bypassed and muted nodes don't count, since they're not going to run. Neither does
default, which just means "wherever ComfyUI was going to put it anyway". - If nothing picks one, you get the card ComfyUI itself is running on. One row.
If you'd rather just see everything, use Watcher · VRAM (All GPUs), which ignores all of that and lists every card ComfyUI can see.
The node tells you which of those it did — SELECTED IN WORKFLOW, COMFYUI DEVICE or
ALL DEVICES — because one row means something different in each case.
The number is the card's actual usage, not just ComfyUI's, so anything else on that GPU counts too. That's on purpose — that's the number that decides whether your next run runs out of memory.
It's the same number nvidia-smi and nvitop show you. ComfyUI's own figure counts memory
that PyTorch is holding on to but not using as free, so it can read several GB lower than every
other tool on your PC. These nodes ask the NVIDIA driver directly instead. On AMD cards they use
ComfyUI's figure with that held memory added back in, which is close but a little high.
AMD works. ComfyUI reports the same stuff on ROCm, and PyTorch calls AMD cards cuda:0 there too,
so it all lines up. The node prints ROCm next to the header so you know it noticed. I don't have
an AMD card to test on, so if it looks wrong on yours, tell me.
About step counts from the ComfyUI UI vs. other clients
Worth knowing, since it's the one confusing bit.
ComfyUI only sends progress messages to whoever submitted the job. If you queue from the ComfyUI tab you're looking at, that's you, and everything works with no extra setup.
If something else queued the job — a second browser tab, a script, your phone, another app — then that tab never gets the progress messages, and the node would sit there with nothing to show.
So this pack also makes ComfyUI send a copy of those progress messages to every open tab, under a different name that ComfyUI's own screens ignore. That's the "progress relay installed" line in the log. It means the nodes work for jobs from anywhere, not just from the tab they're sitting in.
If a future ComfyUI update changes the part this hooks into, that extra bit simply switches itself off. You lose the extra progress info and nothing else — your runs are untouched.
What it won't make up
When it doesn't know something, it says so instead of printing a zero:
- No step data yet →
N/A, not0. - No ETA until it has actually measured a speed. It won't guess one off a single step.
- If you open the tab in the middle of a run, elapsed shows
--, because nobody knows when that run started. Counting from when the tab opened would just be a made-up number.
The speed is the average of the recent per-step times with the pauses thrown out (model loads, checkpoint saves, VAE decode), so it reflects what the sampler is doing now instead of dragging a lifetime average around. On a batch, the progress bar restarts for every image — it handles that, and keeps the speed reading across the gap.
Requirements
- ComfyUI. Tested on 0.45.2 (Windows, NVIDIA RTX 5070 Ti, RTX 3090 and RTX 5060 Ti).
- That's it.
Notes
Fonts (Share Tech Mono, Rajdhani) ship with the folder under web/fonts/ and are SIL Open Font
License. Nothing here phones home, downloads anything, or touches your models.
Bugs, ideas, "it looks wrong on my setup" — open an issue.
License
MIT, see LICENSE.