
Nova Audio Player
Thirty-one nodes for making music with ACE-Step: generation parameters with presets and validation, corrective mastering with rollback and a reproduction fingerprint, an audio player with live visualisers and a BS.1770 measurement panel, track inspection, in-canvas report viewers, tagging and SQLite/MySQL delivery, FLAC and WAV export, and LoRA training.
Nodes (31)
Every ACE-Step dial in one node — and a record of exactly what ran
Stop dragging twenty wires across your ACE-Step graph
Your ACE-Step LoRA starts with a caption nobody wrote
Five minutes now, or three wasted GPU hours later
Train a music LoRA without parking your ComfyUI for three hours
The step where ACE-Step training usually dies
Run this before you queue anything expensive
Master your generated track without leaving the graph
The stock save node gives you 16-bit. Here's why.
24-bit WAV that works on ROCm, plus a switch that proves it
Point it at a folder, get a batch
The debugging node you'll end up using in every graph
Did the file you saved still reproduce the master you approved?
Find the One Node That's Eating Your Whole Run
The loader that tells you what you actually loaded
Release metadata, and an archive name that isn't FINAL_v3
Read the mastering report inside the canvas
For when RAM creeps up and ComfyUI wedges
One node for every path, and a profile to switch albums
Stop exporting every take — Nova Player is a real audio player inside the node
It logs what actually ran, not what you clicked
Stop Retyping the Same Forty Prompts
Your album metadata is in SQLite. Get it into the graph.
Queue the Whole Table and Walk Away
One Row Out, No Loop Attached
Nova SQLite Data Table & Filter 🔎
Prove the tags actually landed
Write your database onto 200 FLACs — without ruining them
Live-theming ComfyUI without the save-reload-guess loop
The node that tells you where to listen
Read the inspection without leaving the graph
Nova Audio Player
Thirty-one nodes for making music with ACE-Step in ComfyUI — generation parameters, corrective mastering, measurement you can trust, report viewers, delivery, and LoRA training.
It started as one player node and grew into the parts around it. The through-line is measurement: every number this pack shows is computed once, in Python, from the audio you are actually looking at, and the same number is what gets logged.
Install
From the Comfy Registry — the supported route:
comfy node install comfyui-novaaudioplayer
Or clone it:
cd ComfyUI/custom_nodes
git clone https://github.com/NovaFemme/ComfyUI-NovaAudioPlayer.git
Restart ComfyUI. Everything lands under ▶️ Nova Audio in the node menu.
One ComfyUI setting worth changing. When you drag a link from an output and drop it on empty canvas, the pack puts the Nova nodes that fit at the top of the suggestion menu. ComfyUI's default opens the node search instead, and the menu is behind Shift. To get the menu on a plain drop, set Settings > LiteGraph > LinkRelease > Action on link release to context menu. The pack does not change this setting for you.
Requirements
Two packages are declared and installed with the pack:
| package | needed by | why it is required |
|---|---|---|
| mutagen | Nova Tag Writer, Nova Tag Reader | there is no degraded mode — tag work without it is not possible |
| pymysql | Nova SQL Dump | pure Python and small; the node reports a clean error if it is missing |
Everything else the pack imports at load time — torch, numpy, PIL, av —
already ships with ComfyUI, so a normal ComfyUI install loads the whole pack
with nothing extra.
Three things are optional and imported only when used:
scipy— used for K-weighting in the LUFS measurement. Without it the player still reports loudness with the correct channel summation, but unweighted and ungated, so treat the figure as approximate.- A separate ACE-Step install — the five LoRA training nodes drive ACE-Step's own trainer. Nothing is installed or downloaded at runtime. Run Nova ACE Setup Check 🩺 first; it reports what is missing without installing anything.
The nodes
Seven groups under ▶️ Nova Audio. Screenshots are linked where one exists; the rest are being filled in.
🛠️ Utility & IO
| Node | What it does |
|---|---|
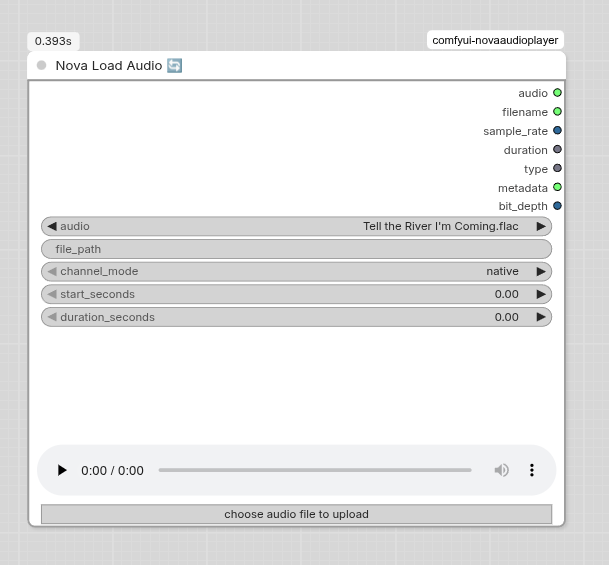
| Nova Load Audio 🔄 | Loads one file or an AUDIO input and returns audio plus filename, sample_rate, duration, type, metadata and bit_depth. Channel mode, start offset and duration are widgets, so trimming happens on load. |
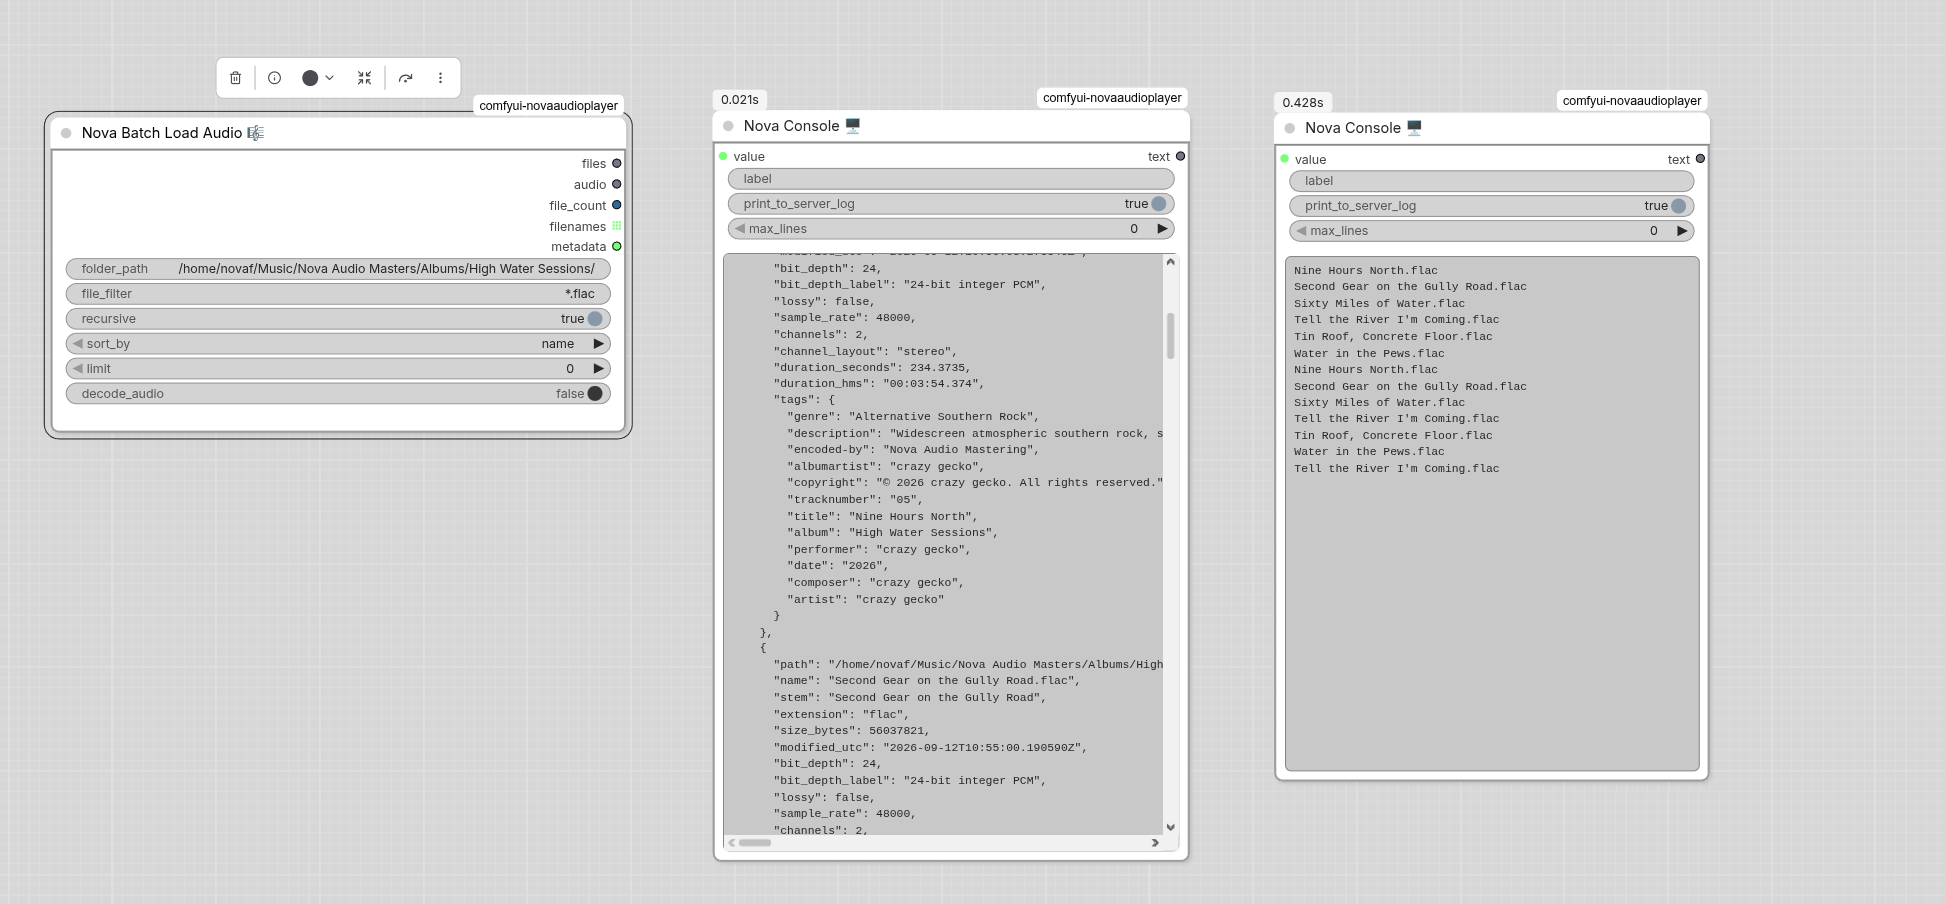
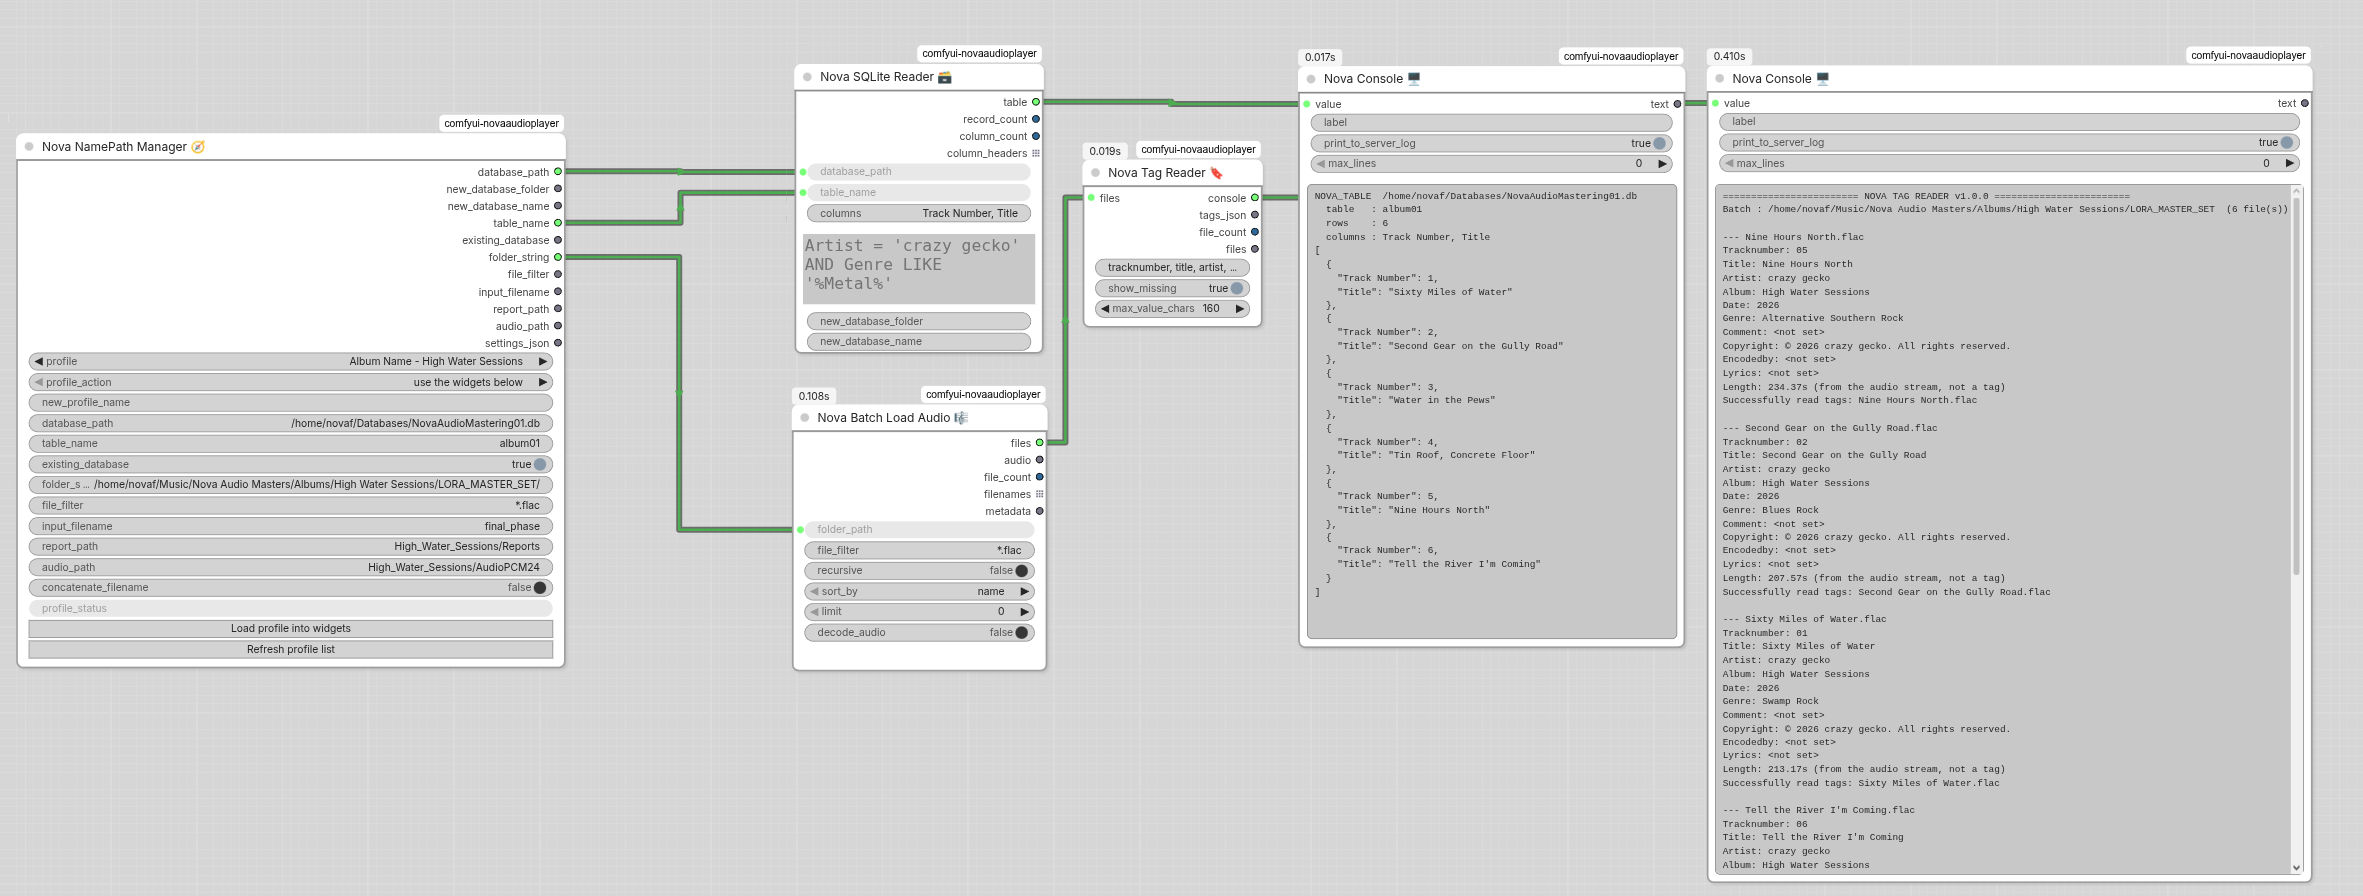
| Nova Batch Load Audio 🎼 | Walks a folder — filter, recursive, sort, limit — and returns a files table, optional decoded audio, a count, filenames and metadata. The front of every batch workflow in this pack. |
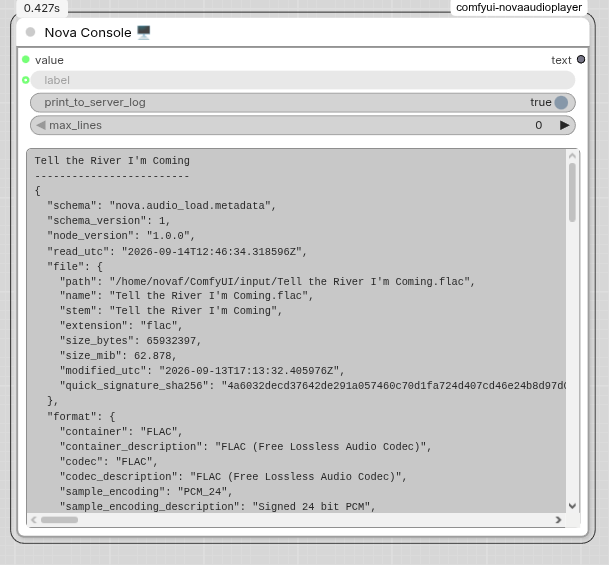
| Nova Console 🖥️ | Prints whatever you wire into it, in the node. The debugging node you end up using constantly. |
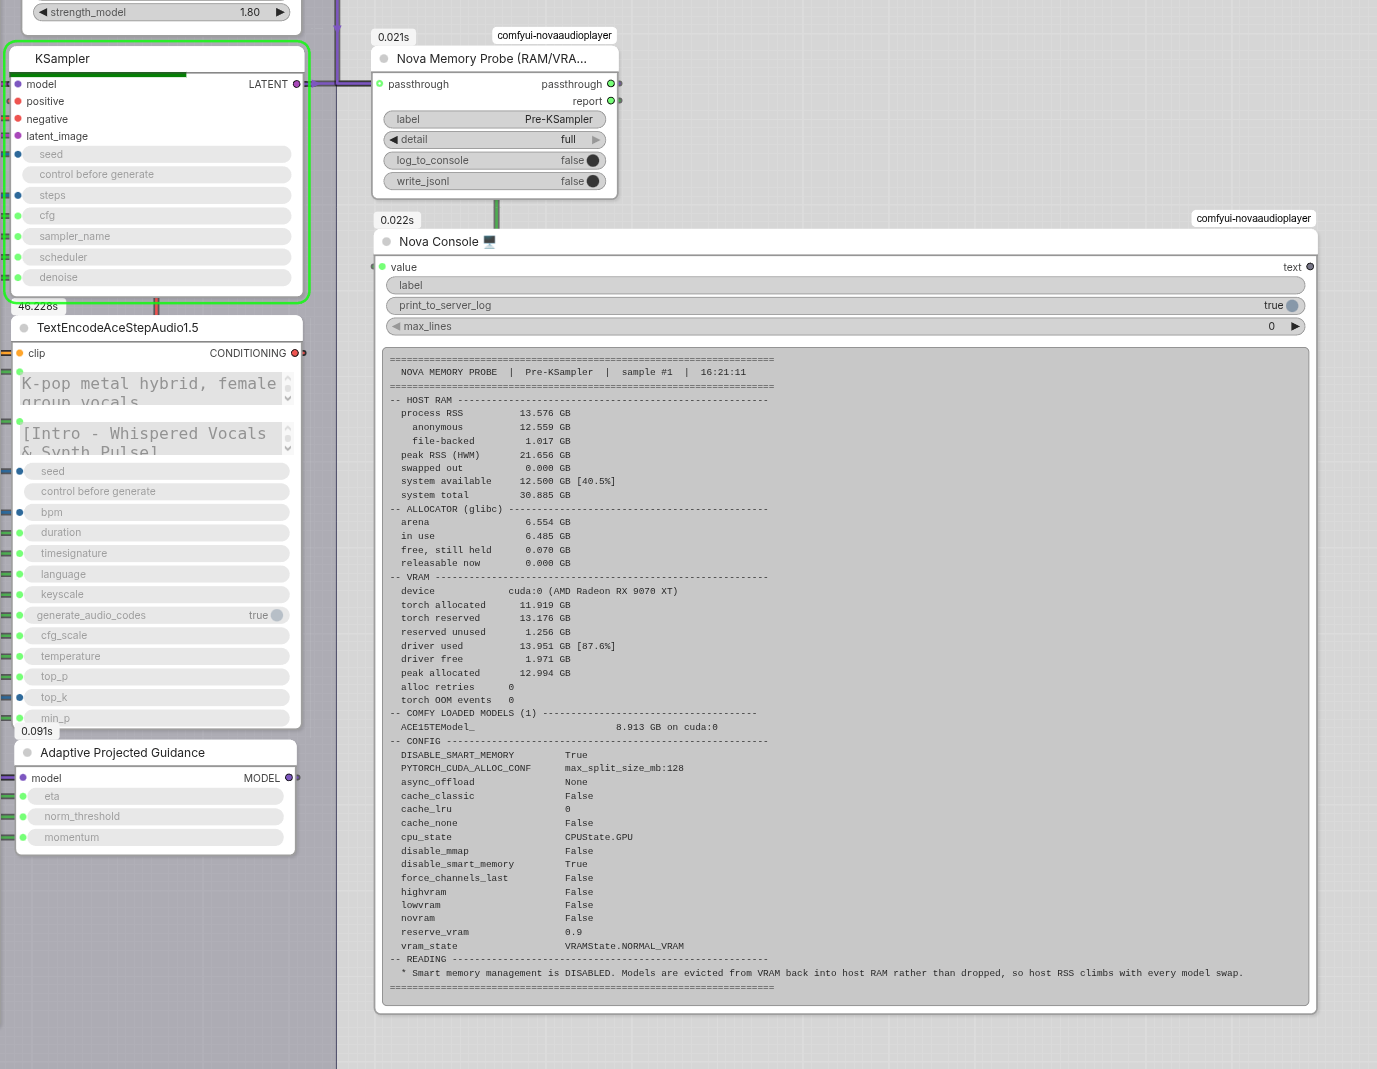
| Nova Memory Probe (RAM/VRAM) 🧠 | Reports host RAM and device VRAM at that point in the graph, with deltas since the probe's previous run. Read-only — it never unloads or frees anything. |
| Nova NamePath Manager 🧭 | Holds every path a delivery workflow needs in one node and stores the whole set as a named profile. |
| Nova FlowPulse 💓 | A live dashboard of where a workflow spends its time: every node that runs is timed and sampled for CPU, RAM, disk and, where a backend exists, GPU. No inputs or outputs; drop it on the canvas and run. Logs to csv, json or markdown. |
| Nova Theme Studio 🎨 | Recolours the whole ComfyUI interface from one palette and can put a wallpaper behind the graph. The theme is global: it applies to every node from every pack and stays applied after the node is deleted. One Enabled / Disabled switch turns all of it off. More below → |
| Nova SQLite Reader 🗃️ [DEPRECATED] | Deprecated: use Nova Dynamic SQLite Browser and the SQLite nodes under Delivery & Metadata. Still works: reads a table out of a SQLite database inside ComfyUI's input folder, and creates the database file there if it does not exist. |
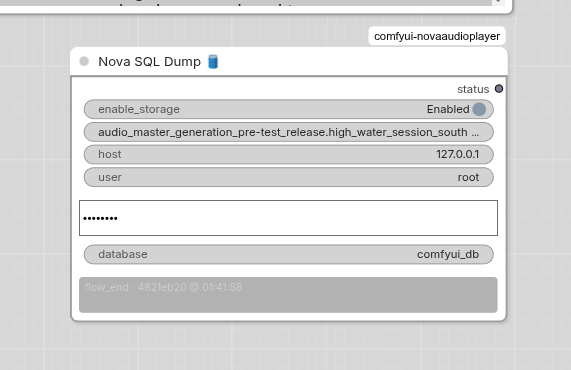
| Nova SQL Dump 🛢️ | Logs every run to a local MariaDB/MySQL, as temporary logging storage. No authentication, local only: it writes as a password-less account that can only add rows to one table. Moving the data to your own database and protecting it is your responsibility; the help page shows how. One-time setup: utilities/nova_sql_dump_setup.sql. |
🤖 Generation & Synthesis
| Node | What it does |
|---|---|
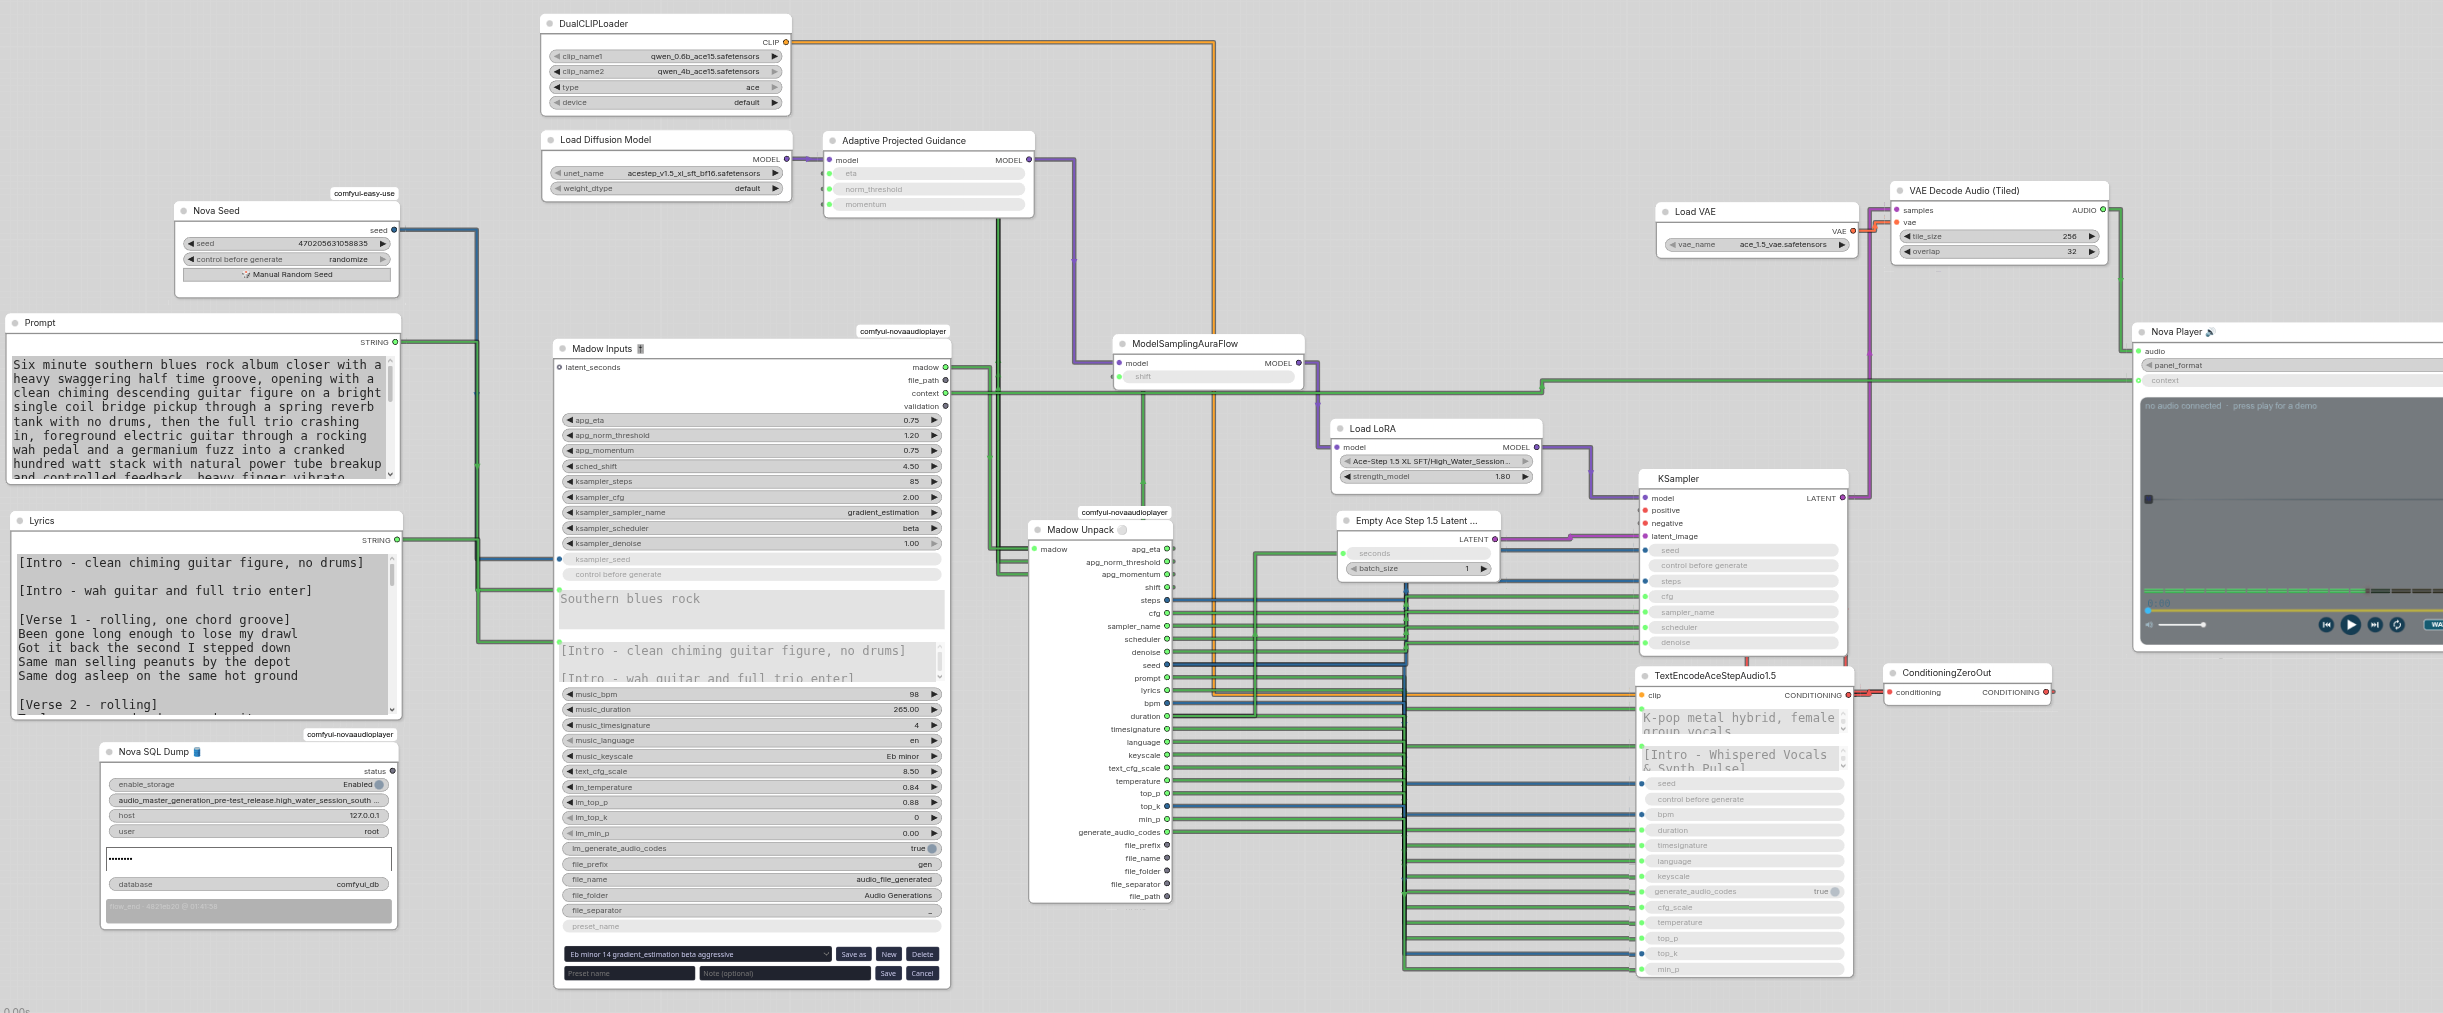
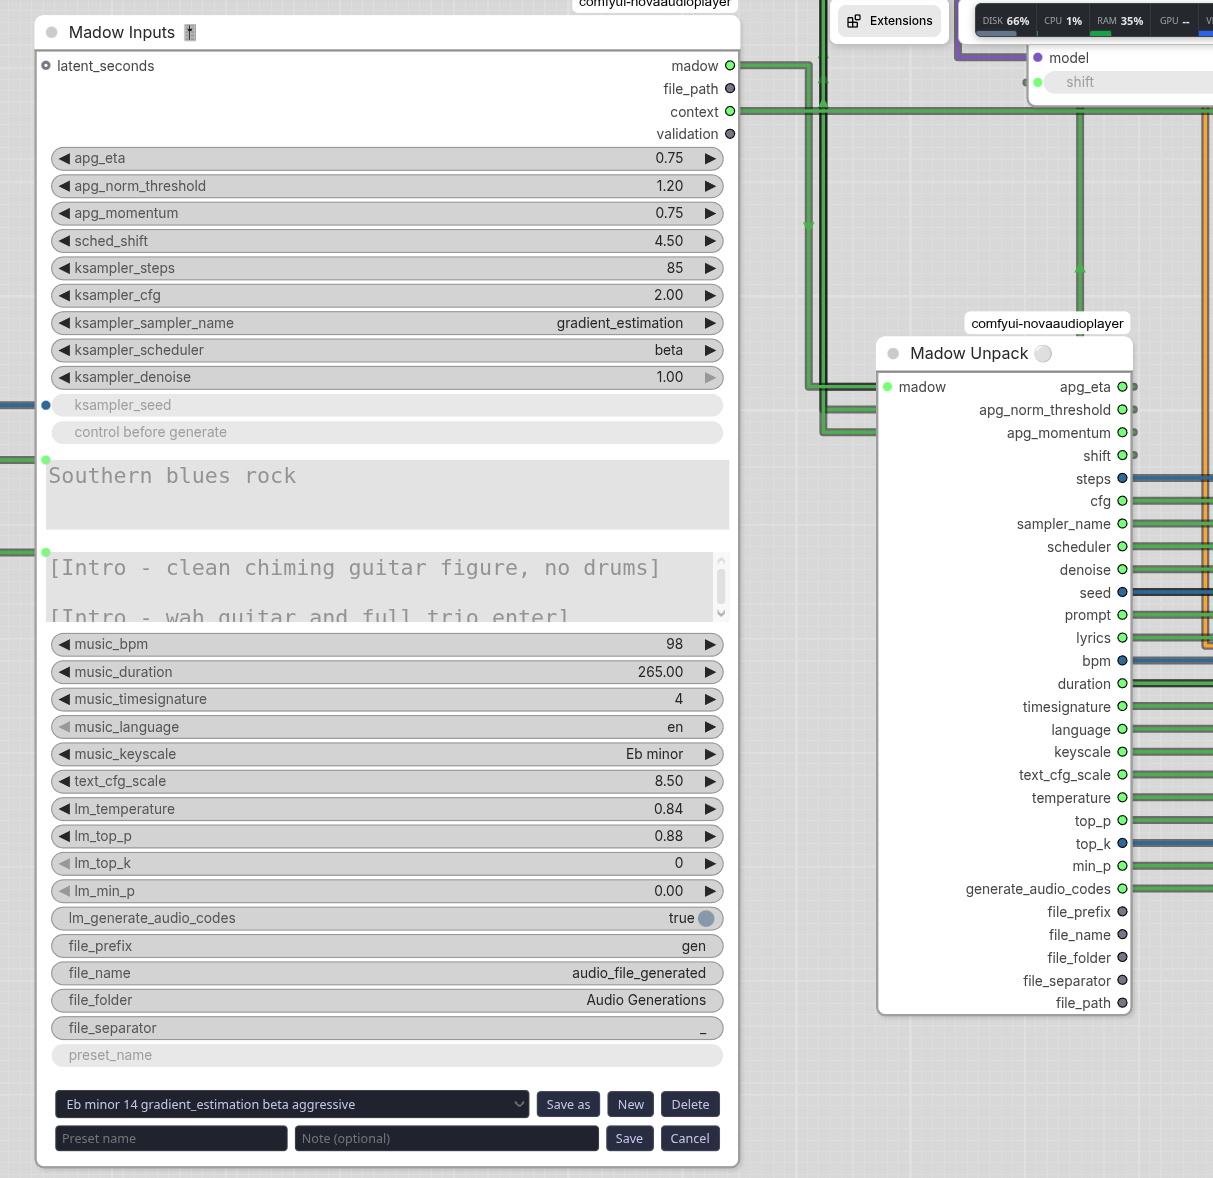
| Madow Inputs 🎚️ | Every ACE-Step generation parameter in one node, with named presets, cross-field validation and a context blob that records exactly what produced a take. |
| Madow Unpack ⚪ | Takes the madow bundle and fans it out into 28 typed outputs — the 27 parameters plus file_path. |
More on how these two split the work →
🎛️ Mastering Process
| Node | What it does |
|---|---|
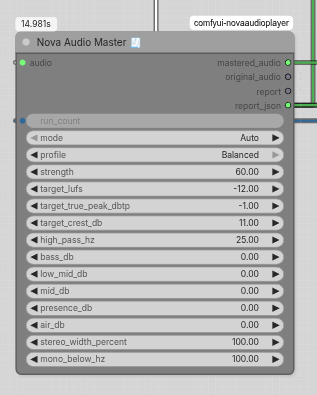
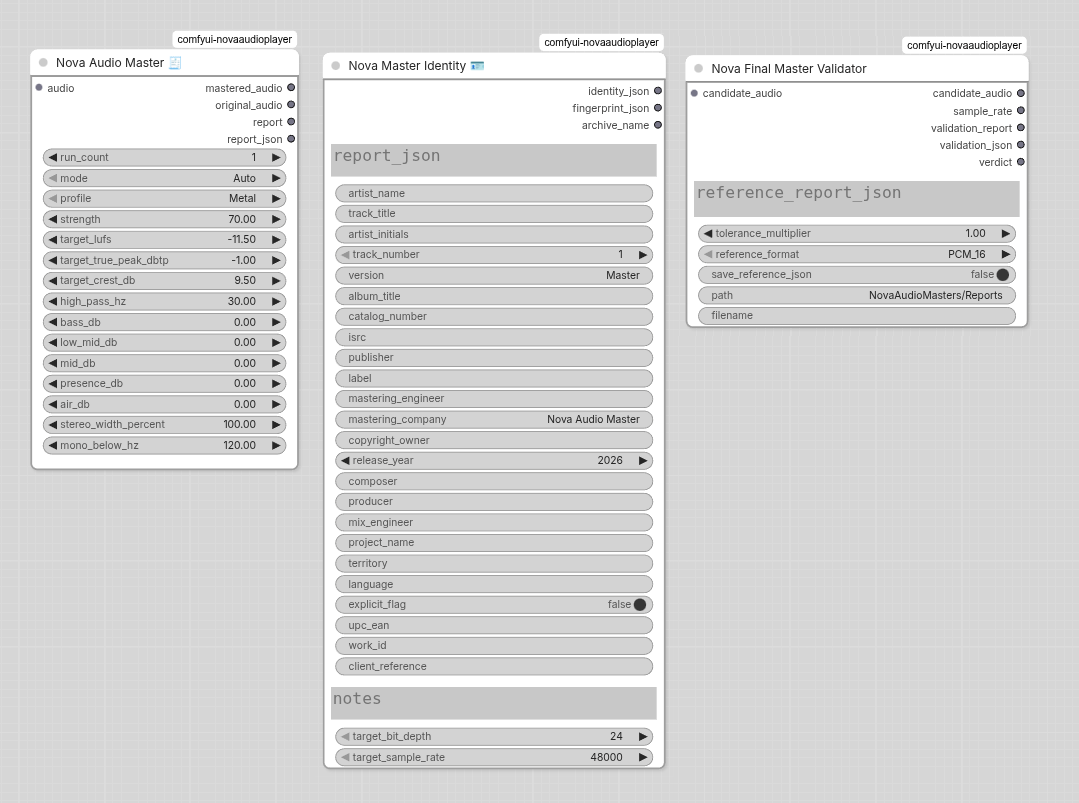
| Nova Audio Master 🧾 | Analyses the source and produces a safer mastered version — tonal, stereo and dynamic correction — with a rollback path and a full report_json. |
| Nova Master Identity 🪪 | Turns a mastering report into release and archive identity: what source, what settings, what came out. |
📊 Analysis & Validation
| Node | What it does |
|---|---|
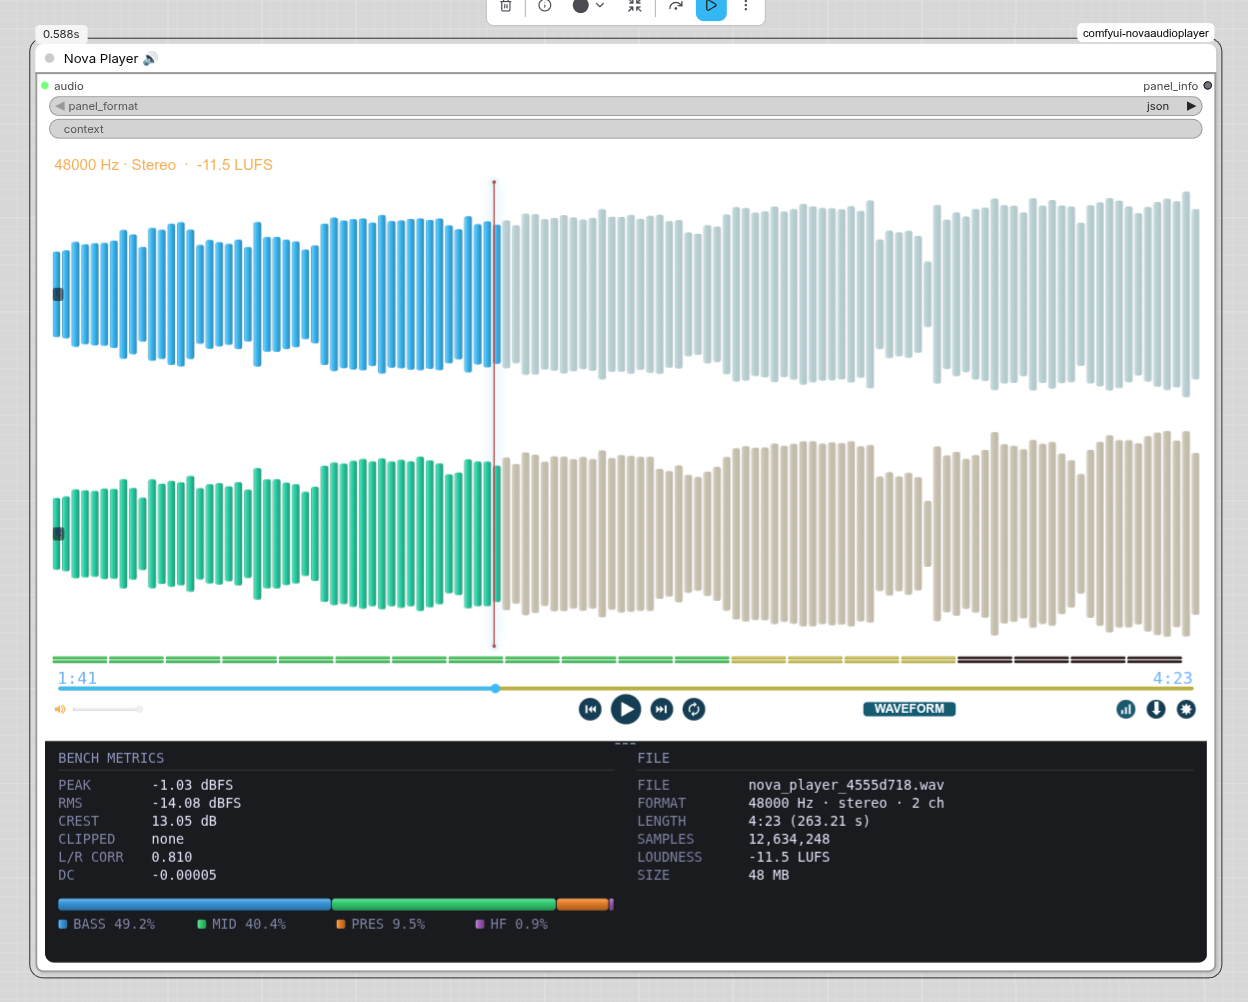
| Nova Player 🔊 | The player: thirteen live visualisers, a whole-file measurement panel, a theme system, and a panel_info output for logging every take. |
| Nova Track Inspector 🔬 | Analyses the whole track over time and tells you where to listen, against a baseline. |
| Nova Final Master Validator ✅ | Answers one question: did the file you saved still reproduce the master you approved? |
🗂️ Data Viewers
Read-only nodes that render a report inside the canvas, so you never leave the graph to read what just happened.
| Node | Renders |
|---|---|
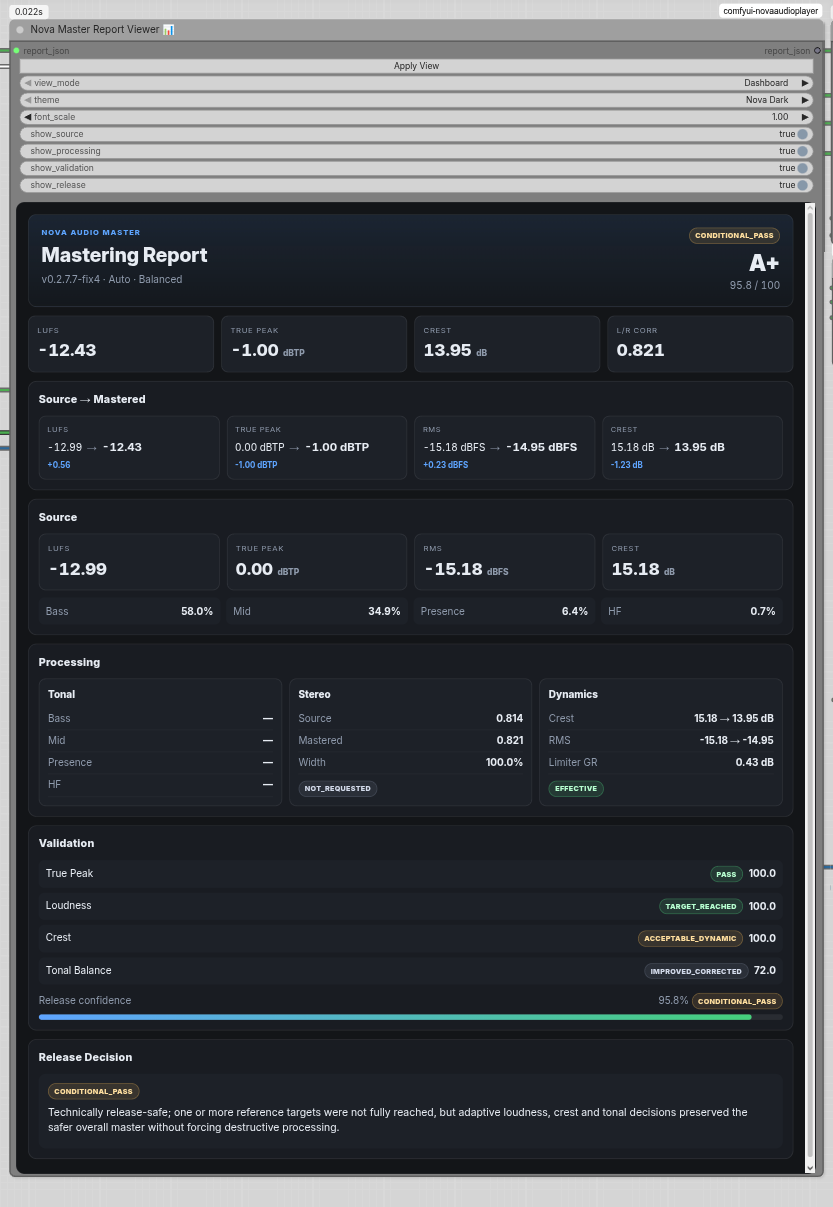
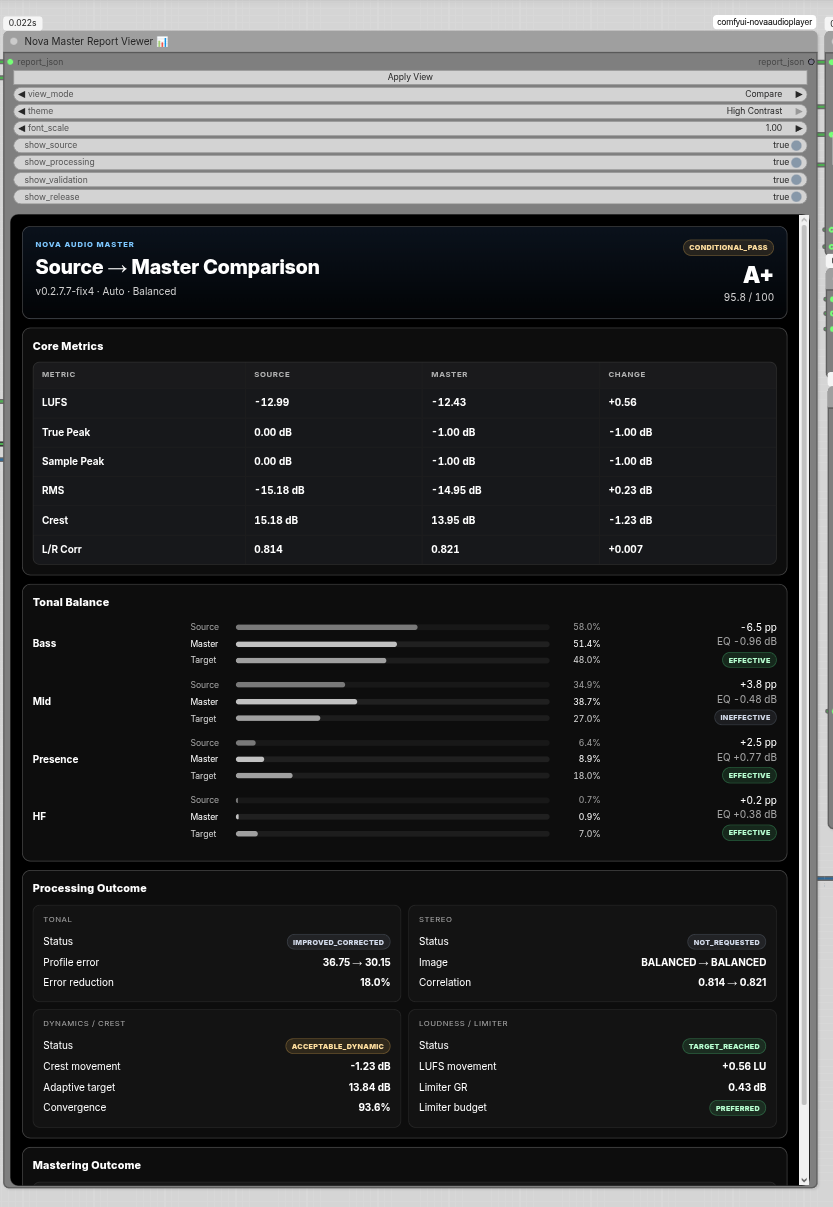
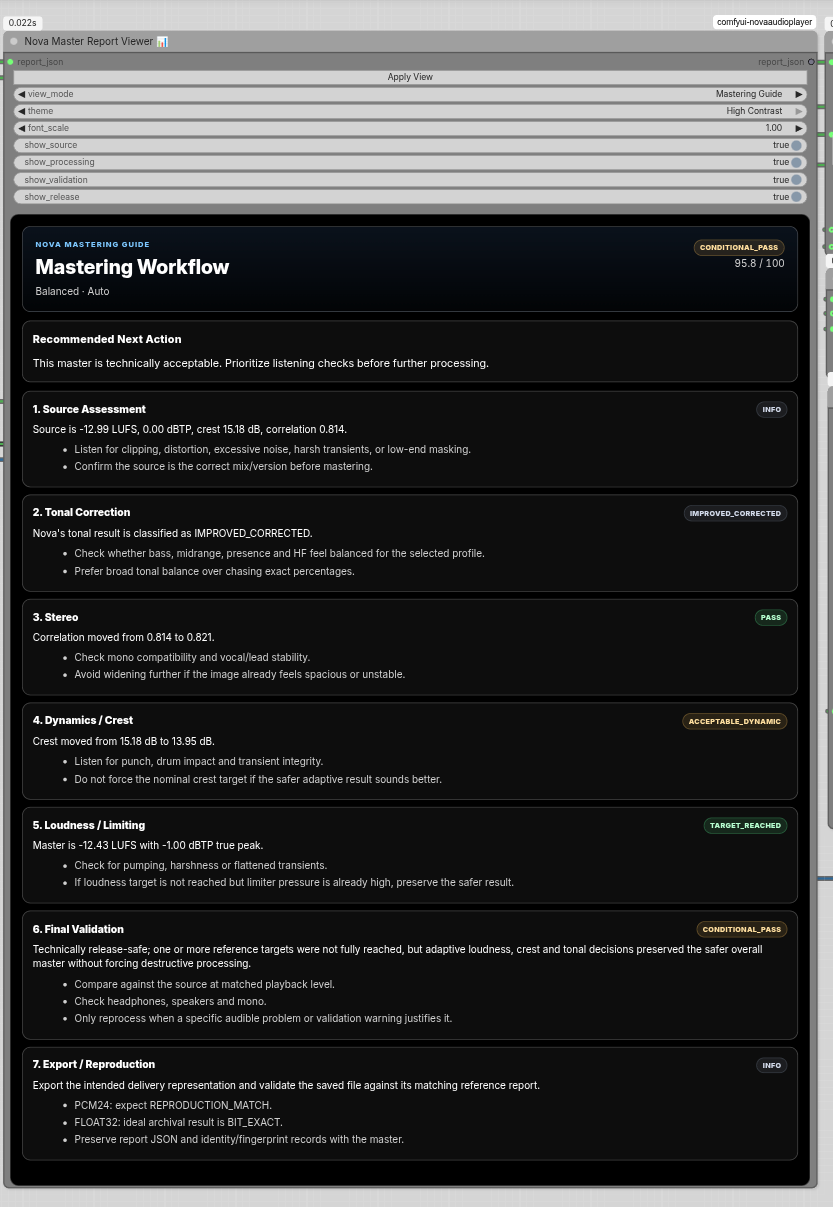
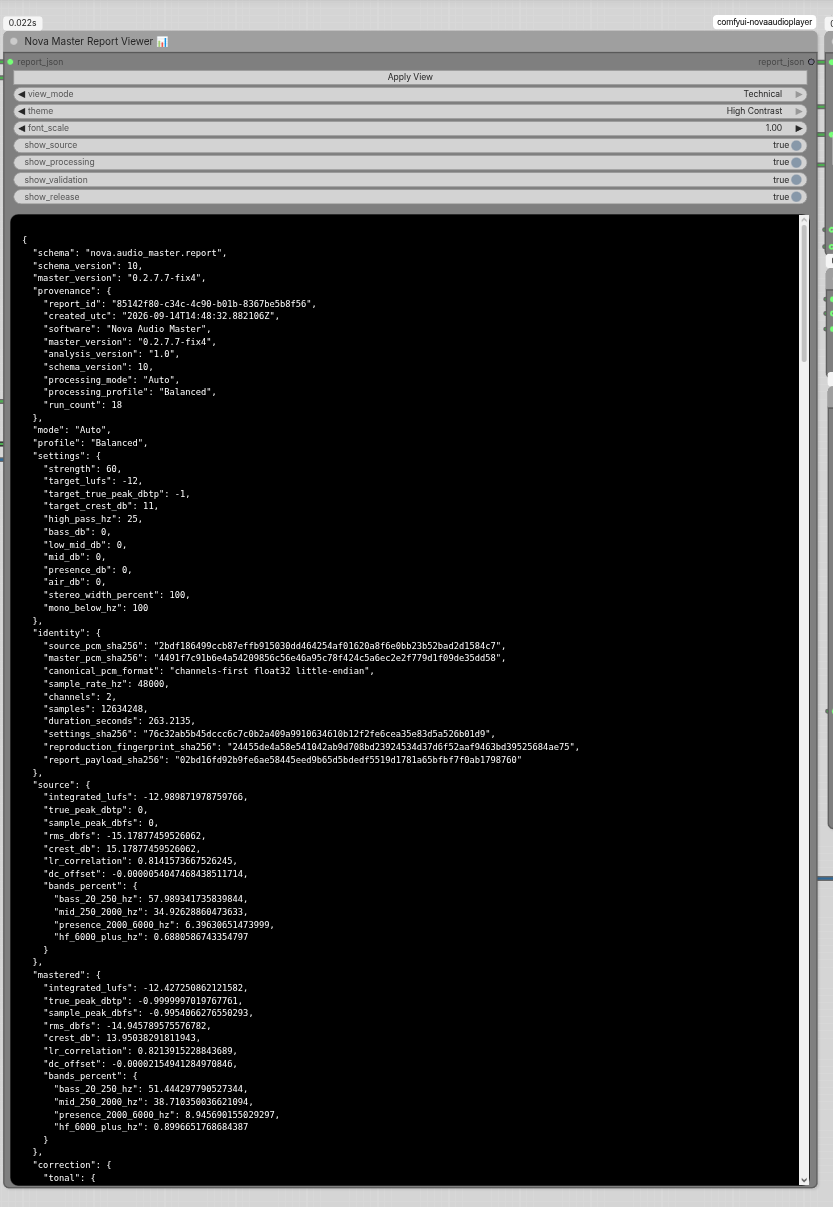
| Nova Master Report Viewer 📊 | report_json from Nova Audio Master |
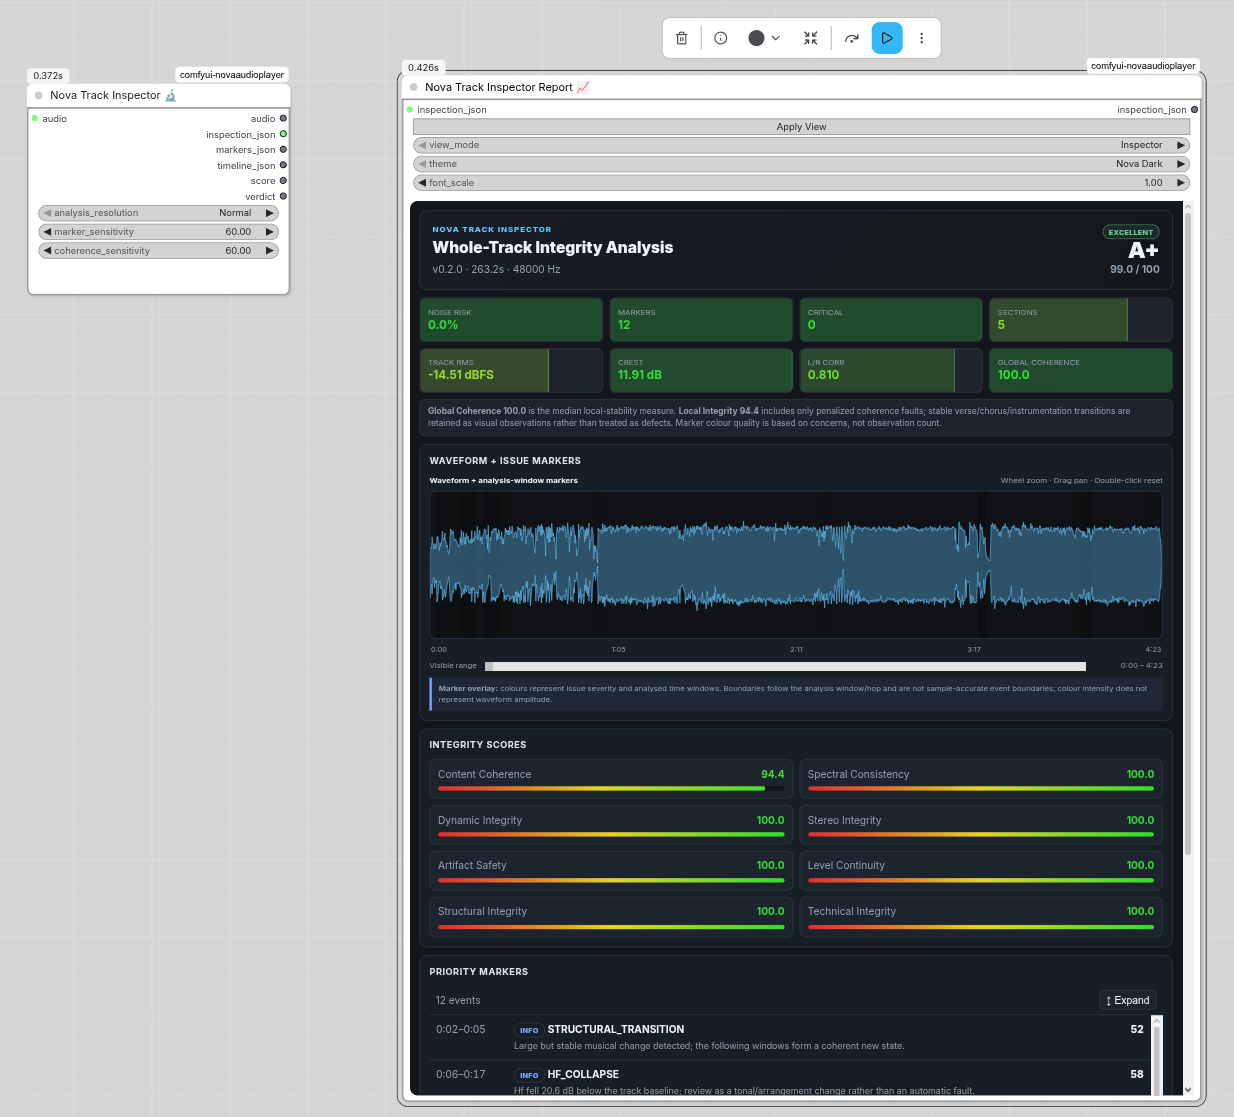
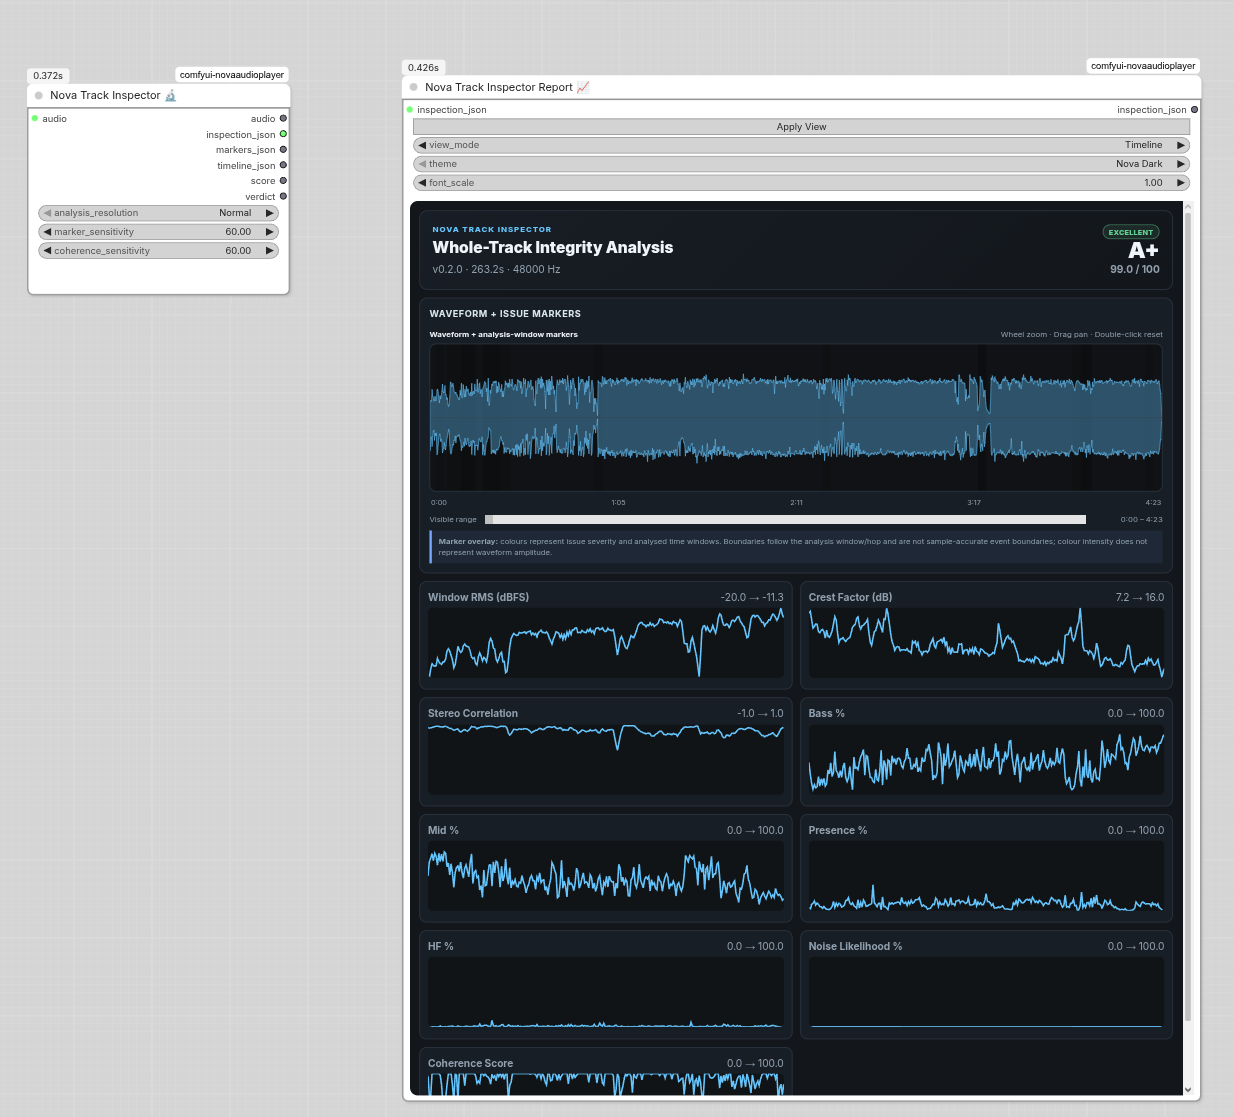
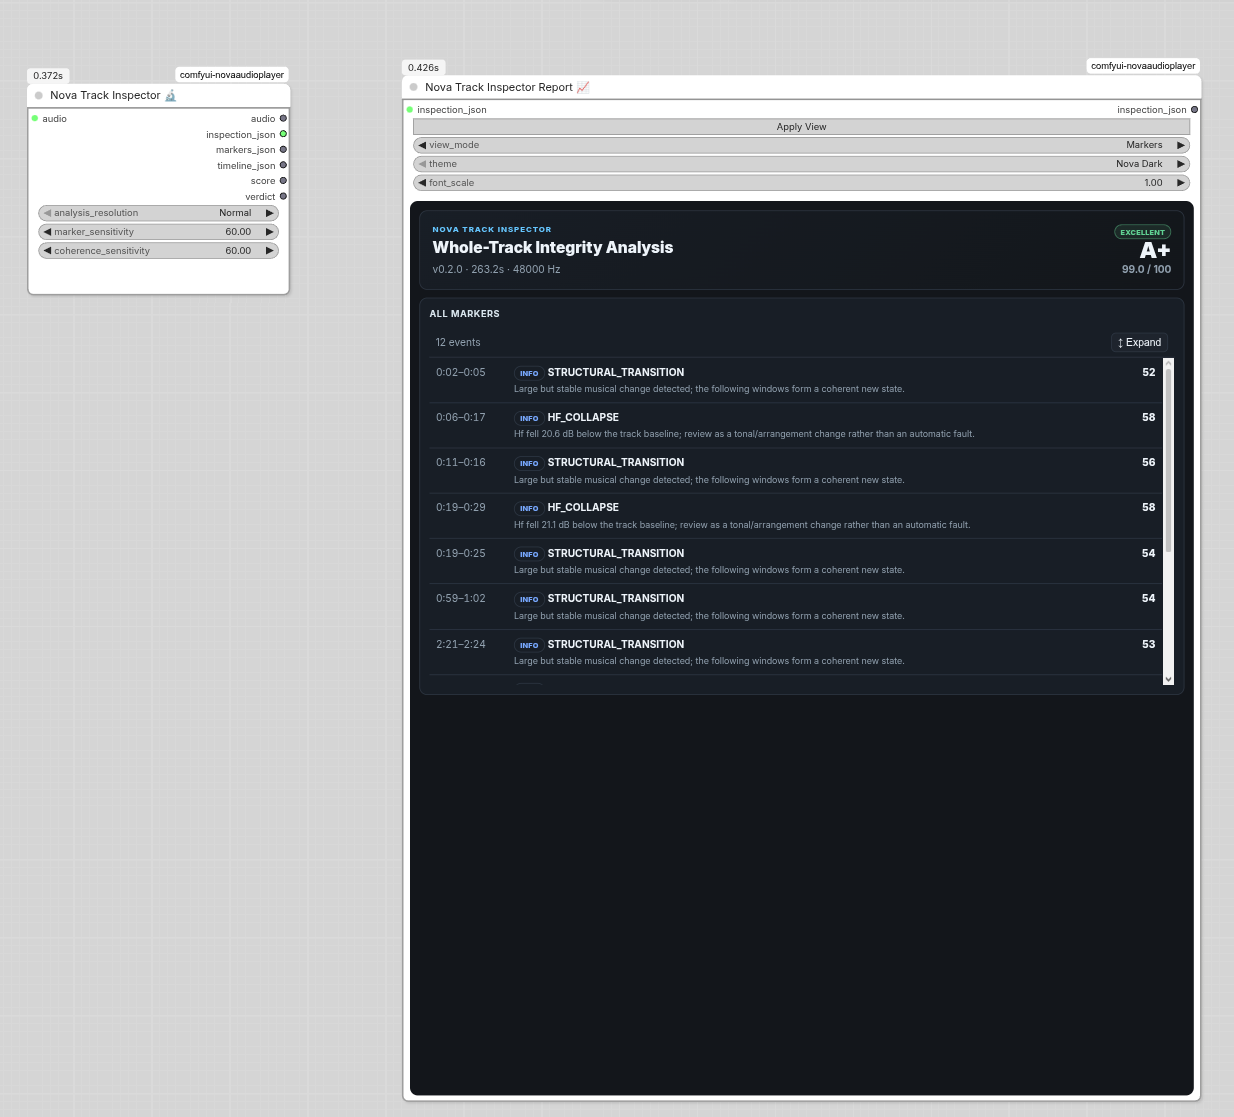
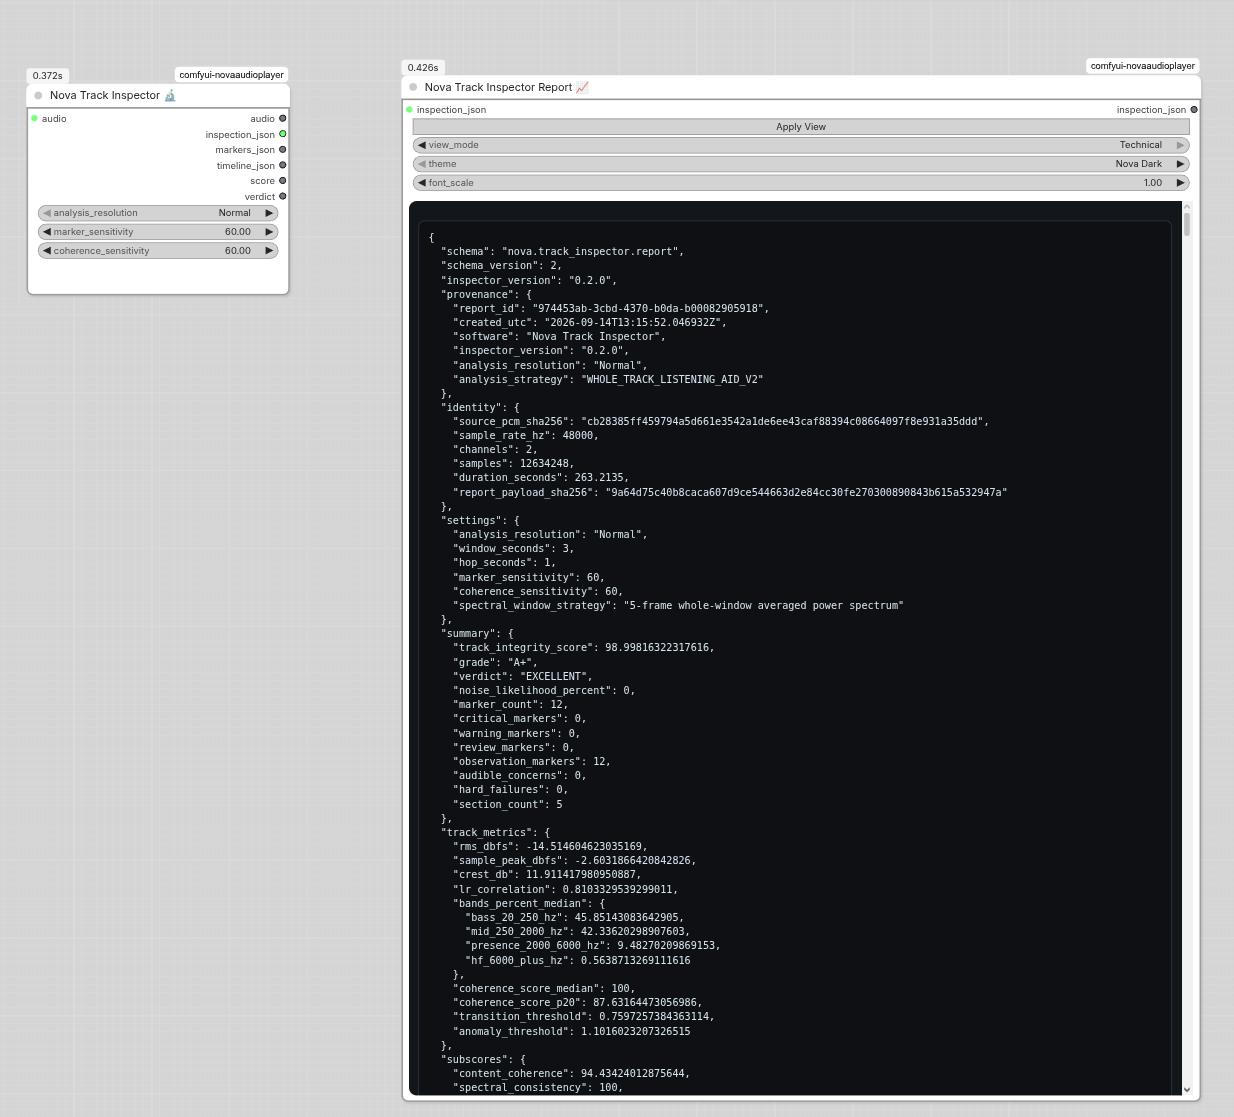
| Nova Track Inspector Report 📈 | inspection_json from Nova Track Inspector |
Each has several view modes on one widget, and every view exports as a PNG from the node's right-click menu — the image is rasterised from the viewer's own live DOM, so it looks exactly like what is on screen rather than being redrawn a second time.
Nova Master Report Viewer — Dashboard, Compare, Mastering Guide, Technical:
Nova Track Inspector Report — Inspector, Timeline, Markers, Technical:
📦 Delivery & Metadata
| Node | What it does |
|---|---|
| Nova Save Audio FLAC 24/16-bit ⬇️ | Writes an AUDIO input to FLAC at 24-bit or 16-bit. |
| Nova Save Audio WAV PCM16|PCM24|FLOAT32 ⬇️ | Writes RIFF/WAVE at 16-bit PCM, 24-bit PCM or 32-bit float. |
| Nova Tag Writer 🏷️ | Writes a table of metadata onto files, with column mapping, skip rules and a dry-run mode that reports without touching anything. |
| Nova Tag Reader 🔖 | Reads tags off a file list into a console report and tags_json. |
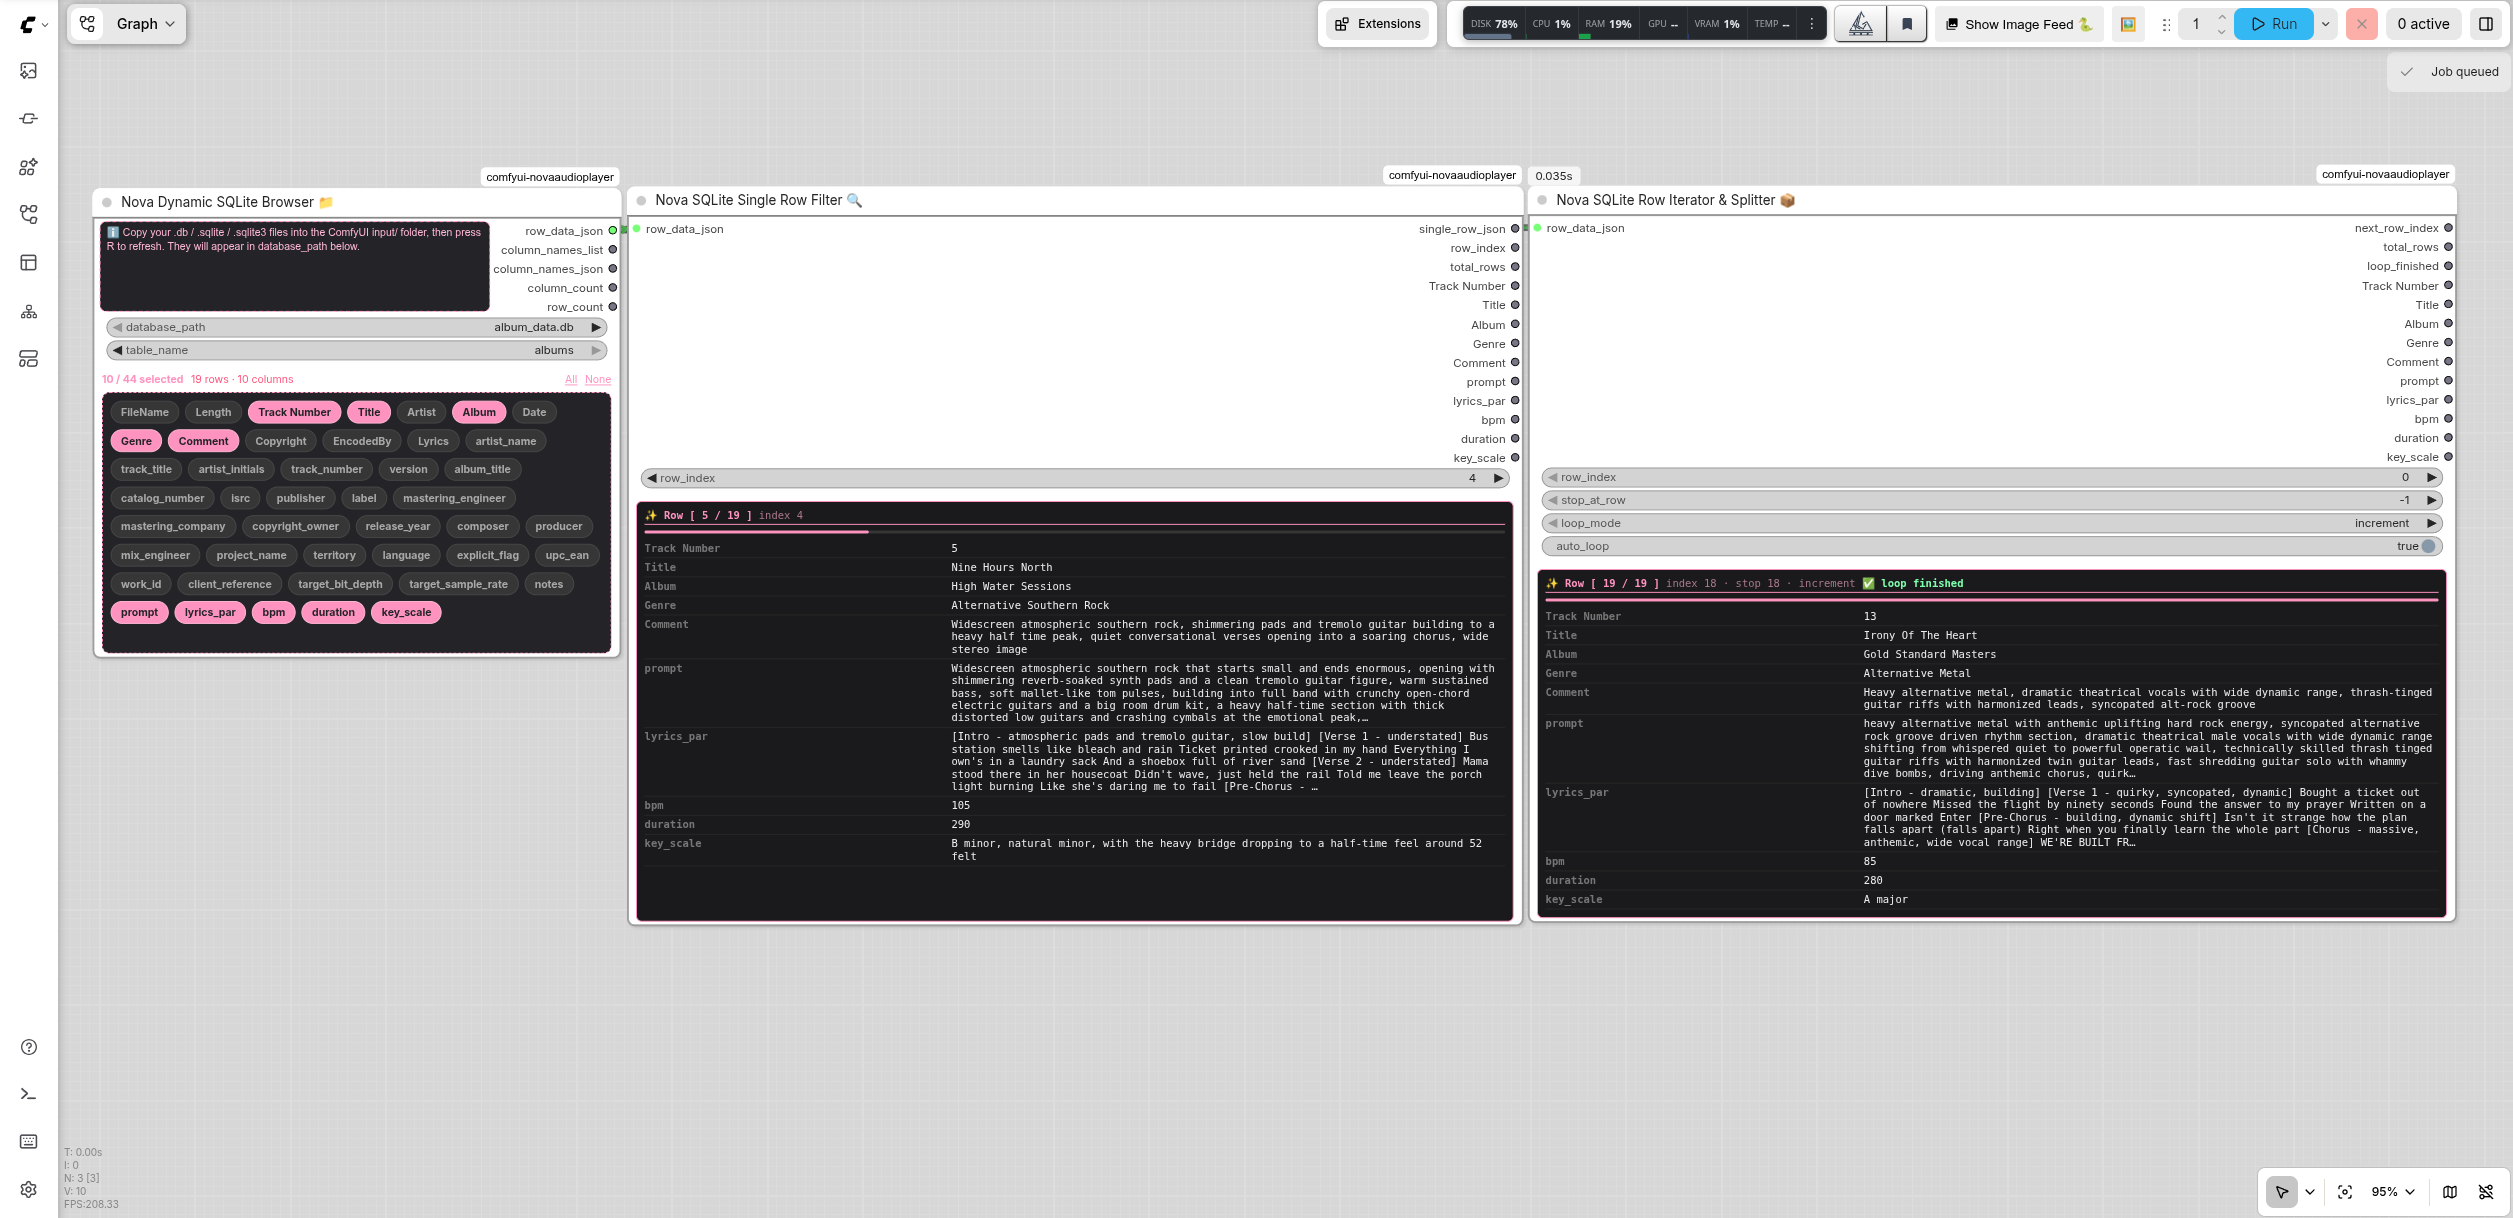
| Nova Dynamic SQLite Browser 📁 | Pick a SQLite database in ComfyUI's input folder, a table and its columns. Outputs the rows. |
| Nova SQLite Data Table & Filter 🔎 | Shows rows in a grid, filters them with conditions you build in the node (no SQL), and outputs the matching or the selected rows. New in 2.7.0. |
| Nova SQLite Row Iterator & Splitter 📦 | Loops through the rows and outputs each column of the current row. |
| Nova SQLite Single Row Filter 🔍 | Outputs each column of one selected row, with no loop. |
The four SQLite nodes chain together: Browser → Data Table & Filter → Row
Iterator or Single Row Filter. Nova Master Identity reads the Single Row
Filter's single_row_json directly and maps the column names itself.
Report images are no longer a node. Exporting a report view is a right-click entry on the viewer itself, which is both fewer nodes to wire and a picture that matches the screen exactly.
🎓 LoRA Training
Five nodes that drive ACE-Step's own training pipeline. They need a separate ACE-Step install; this pack installs and downloads nothing at runtime.
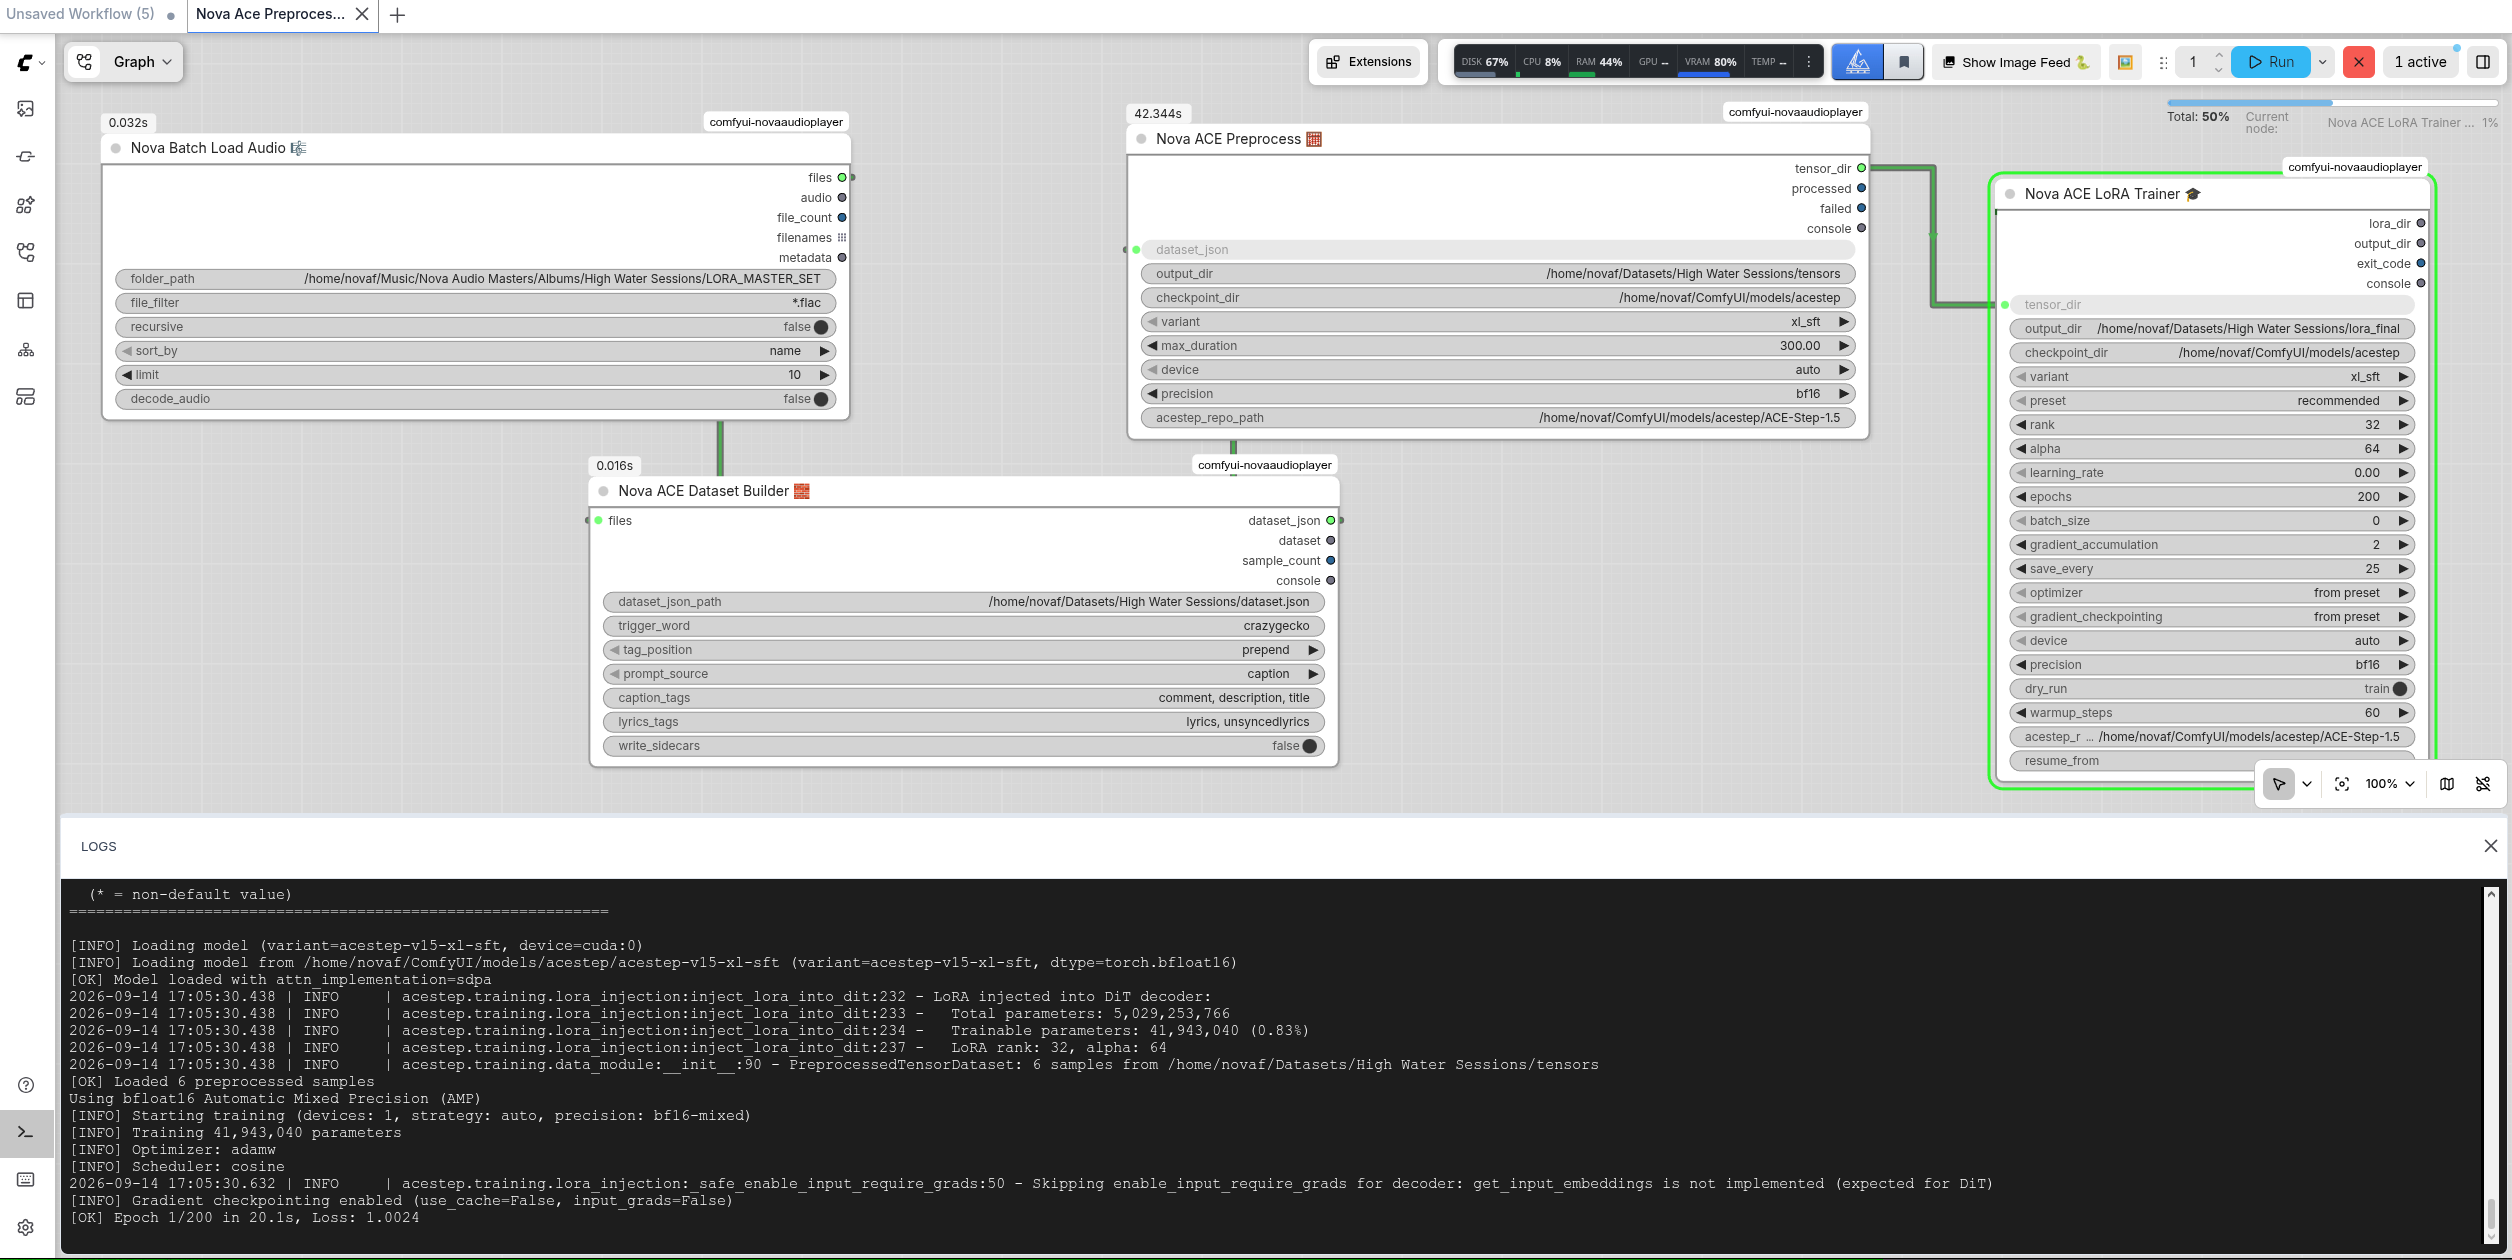
| Node | What it does | |---|---| | Nova ACE Dataset Builder 🧱 | Turns a batch of tagged audio into the dataset JSON ACE-Step's preprocessor expects. | | Nova ACE Dataset Review 🔍 | Checks a dataset before you spend GPU hours on it. ACE-Step's own docs make manual review mandatory; this is that pass. | | Nova ACE Preprocess 🧮 | Runs ACE-Step's two-pass tensor generation over a Nova dataset. | | Nova ACE LoRA Trainer 🎓 | Runs ACE-Step's LoRA training loop over those tensors, as a cancellable child process. | | Nova ACE Setup Check 🩺 | Answers one question before you queue anything expensive: is this machine ready to preprocess and train? It reports only — it never installs, downloads or spawns anything. |
The player
Drop Nova Player 🔊 into a workflow and connect any AUDIO output.
New to it? Read the Nova Player User Guide: step by step, with pictures, and a section for when you get stuck.
Thirteen views, one button
Cycle them with the pill in the transport row. Every view is a separate module and every one is themeable.
| View | | |
|---|---|---|
| Waveform | Stereo peak bars with a pulse at the playhead | |
| Spectrum / EQ | Filled spectrum curve with a neon rim | 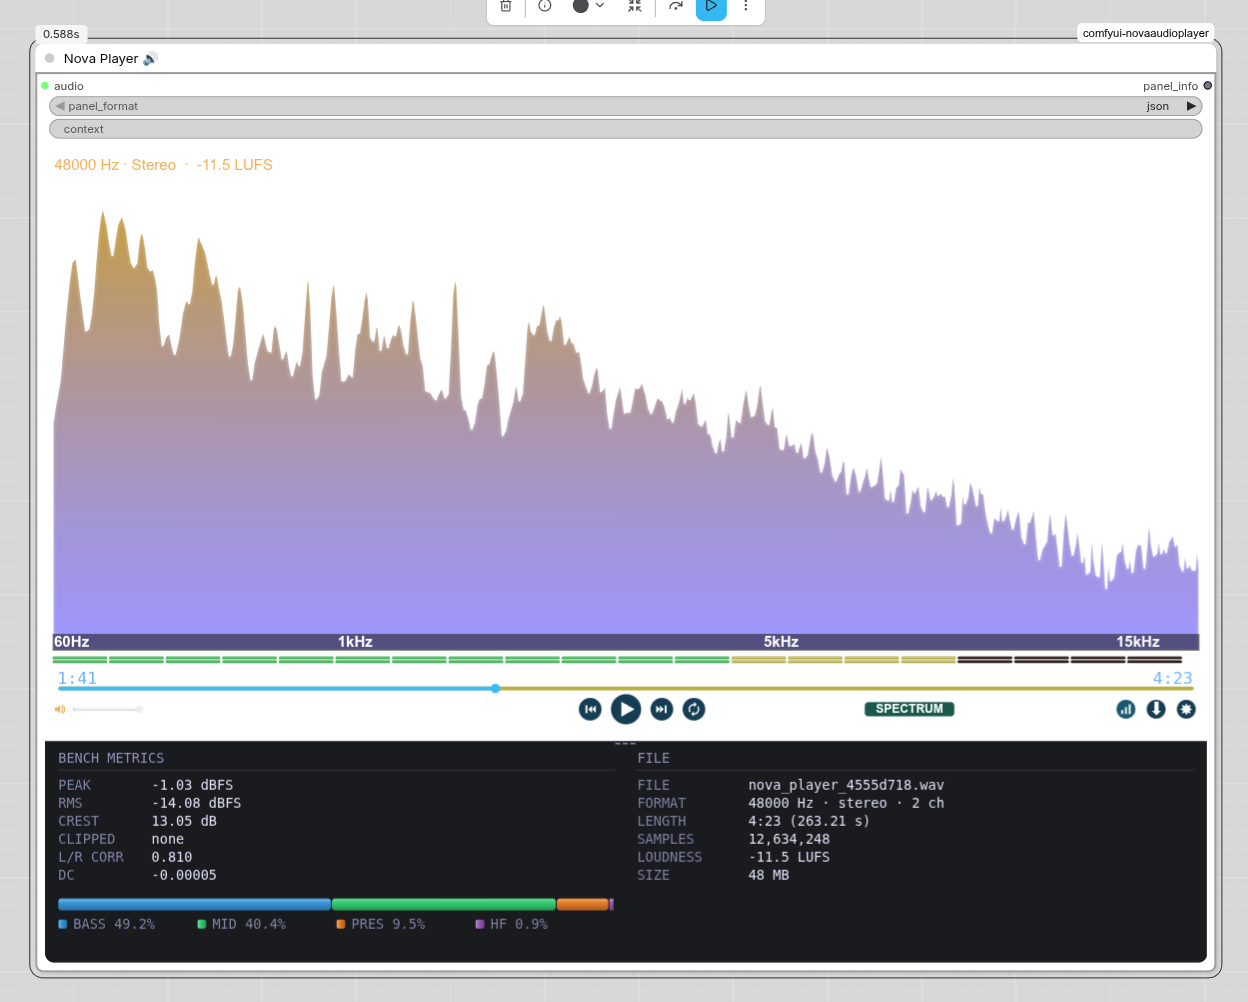 |
| Analyzer | Goniometer and phase-correlation needle |
|
| Analyzer | Goniometer and phase-correlation needle | 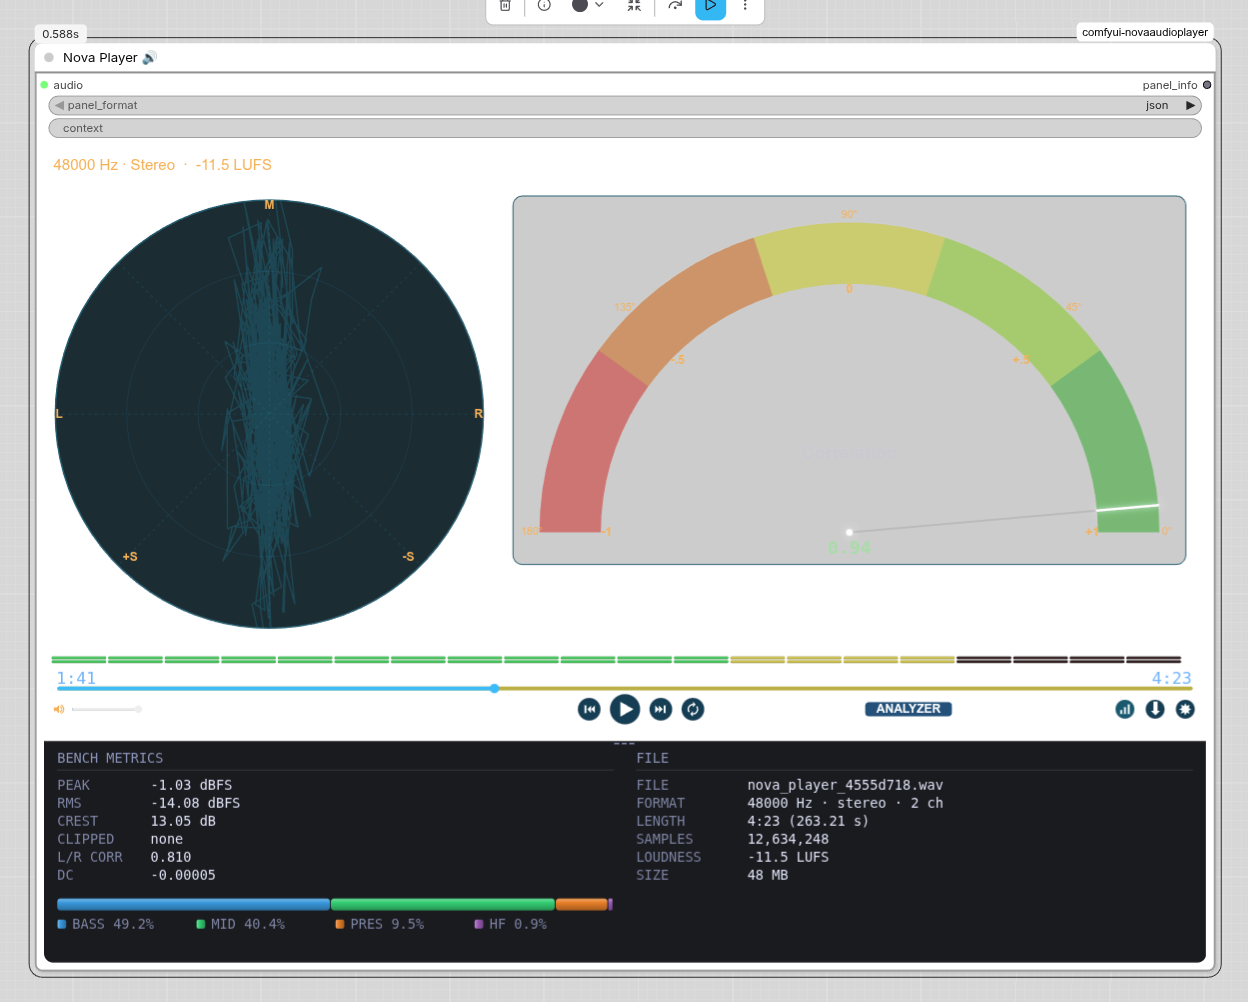 |
| Spectrogram | Scrolling heat map, on a real time axis |
|
| Spectrogram | Scrolling heat map, on a real time axis | 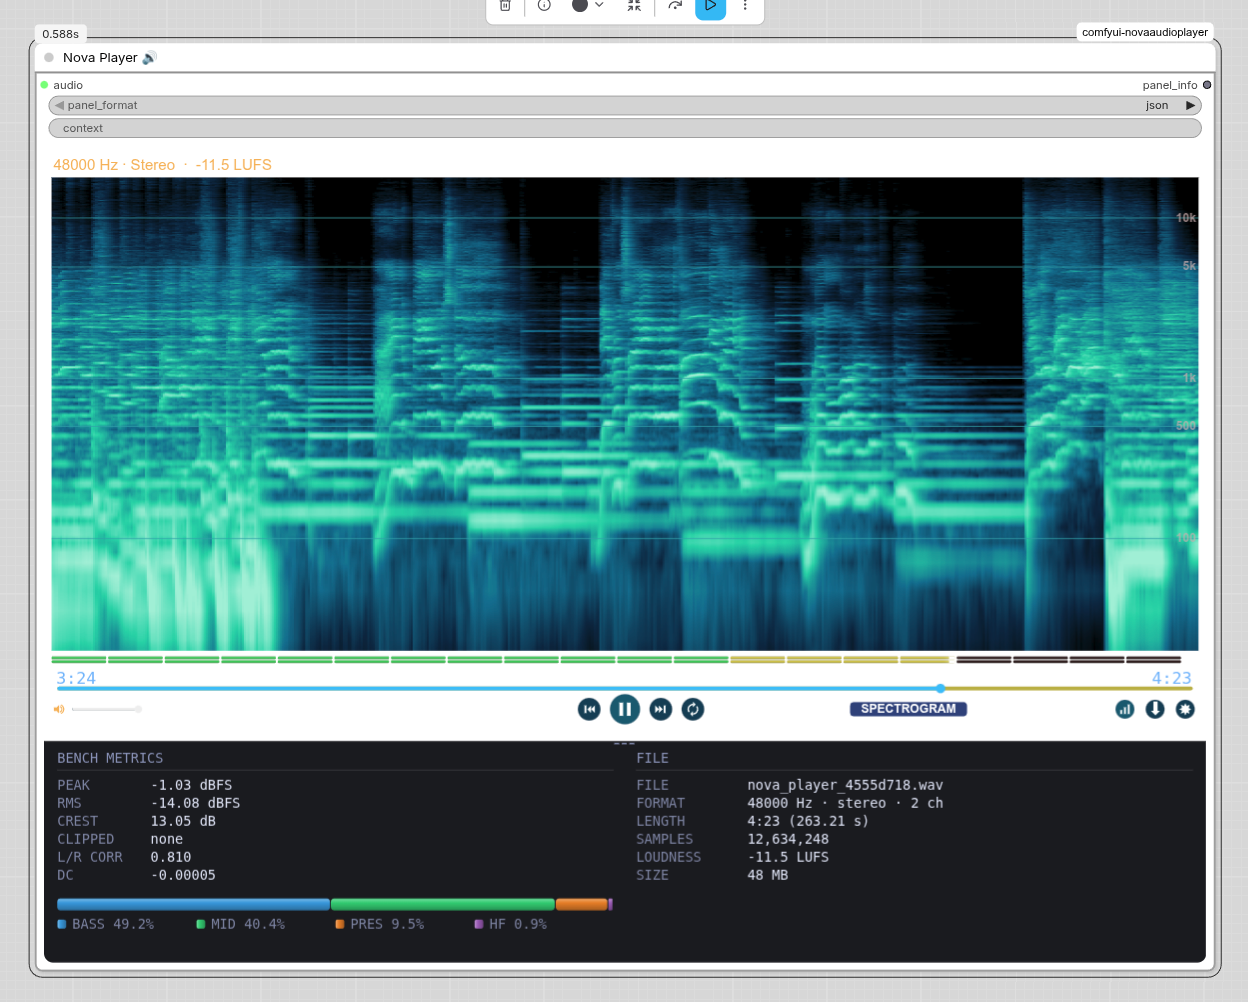 |
| Combined | Waveform, spectrum and spectrogram together |
|
| Combined | Waveform, spectrum and spectrogram together | 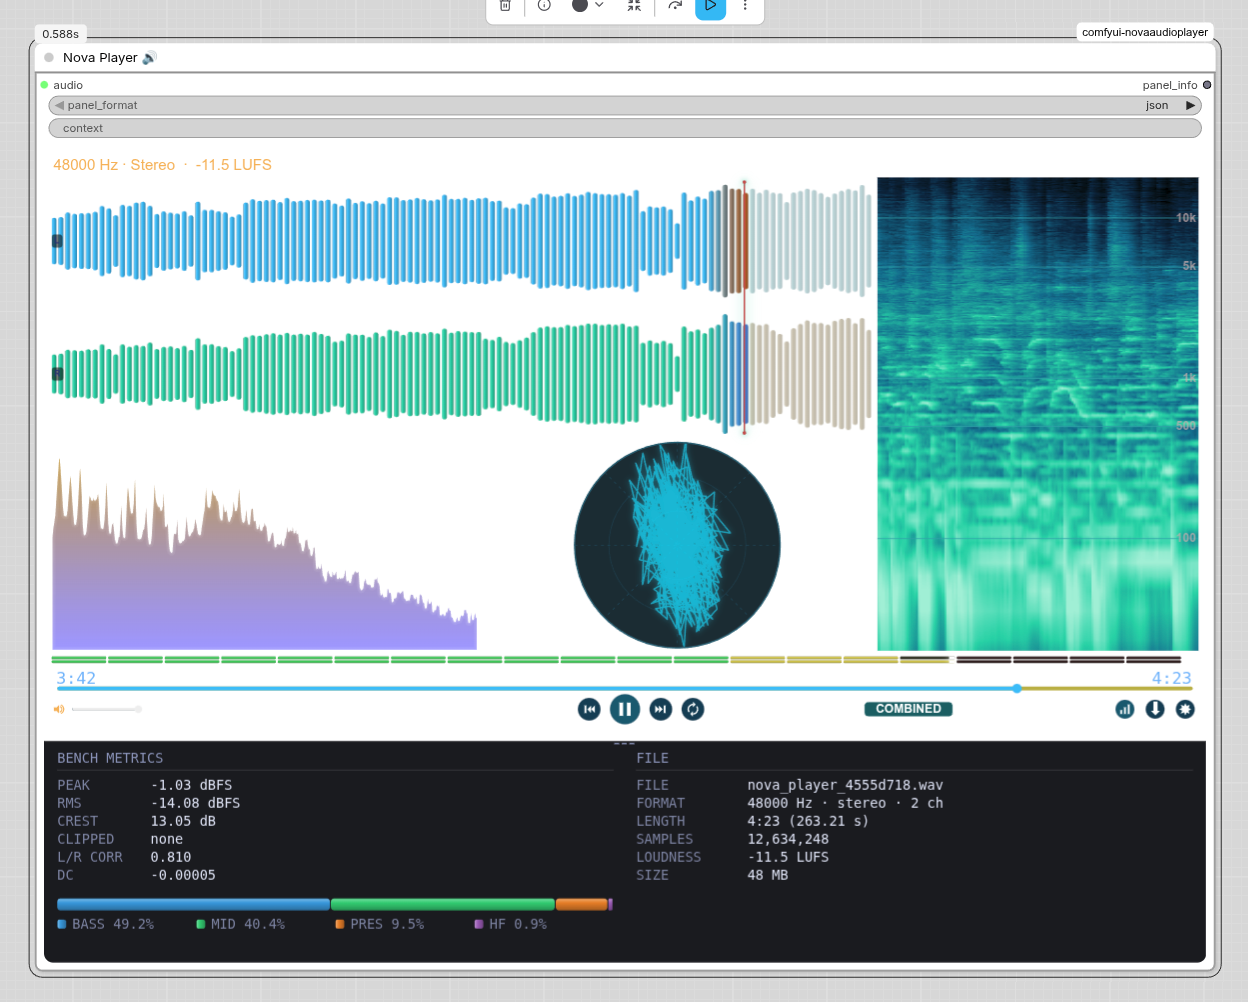 |
| Peak / RMS | Level meters with peak hold and decay |
|
| Peak / RMS | Level meters with peak hold and decay | 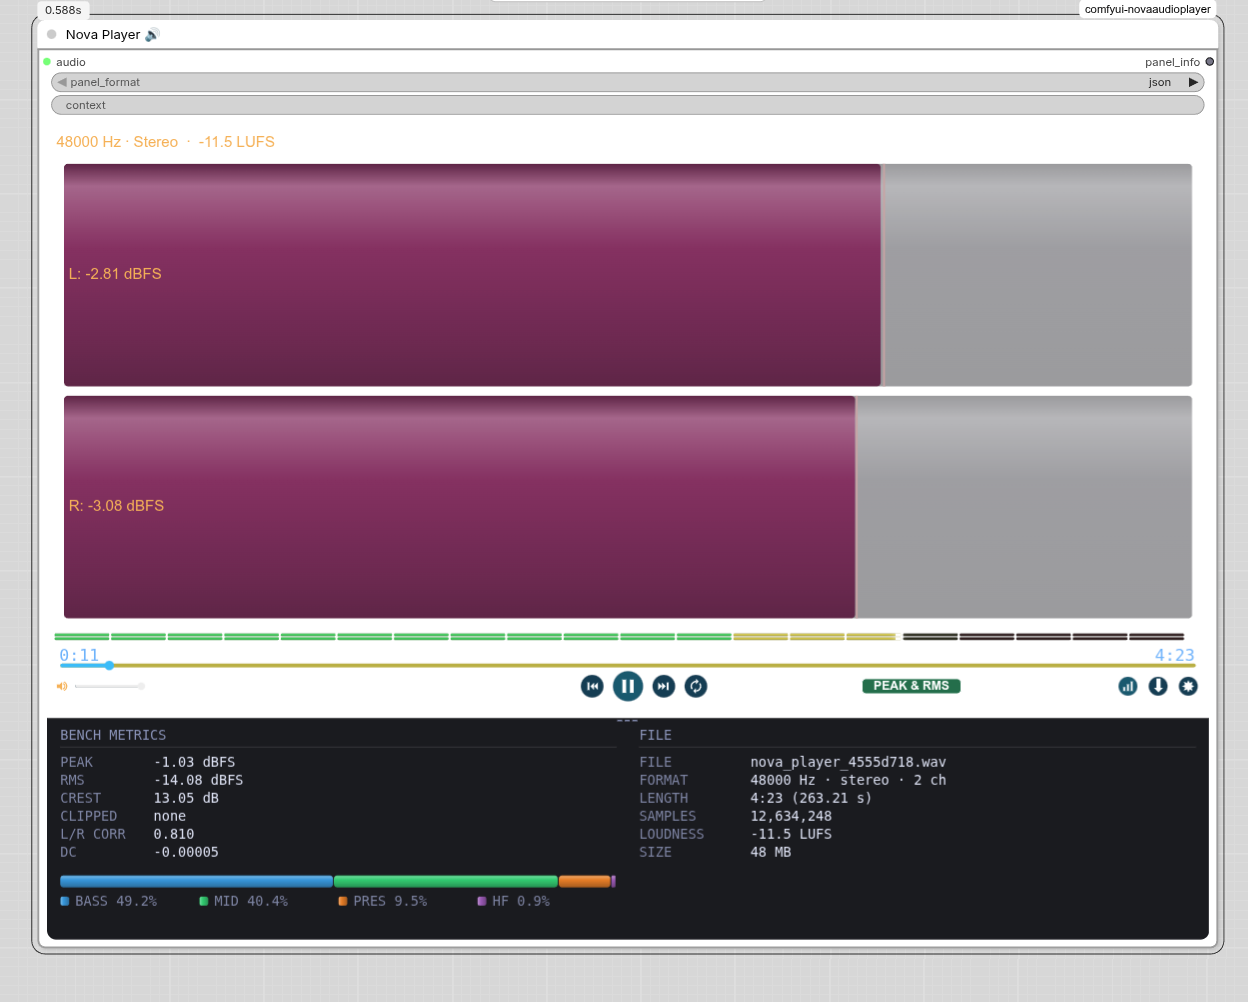 |
| L/R Correlation | Phase relationship over time |
|
| L/R Correlation | Phase relationship over time | 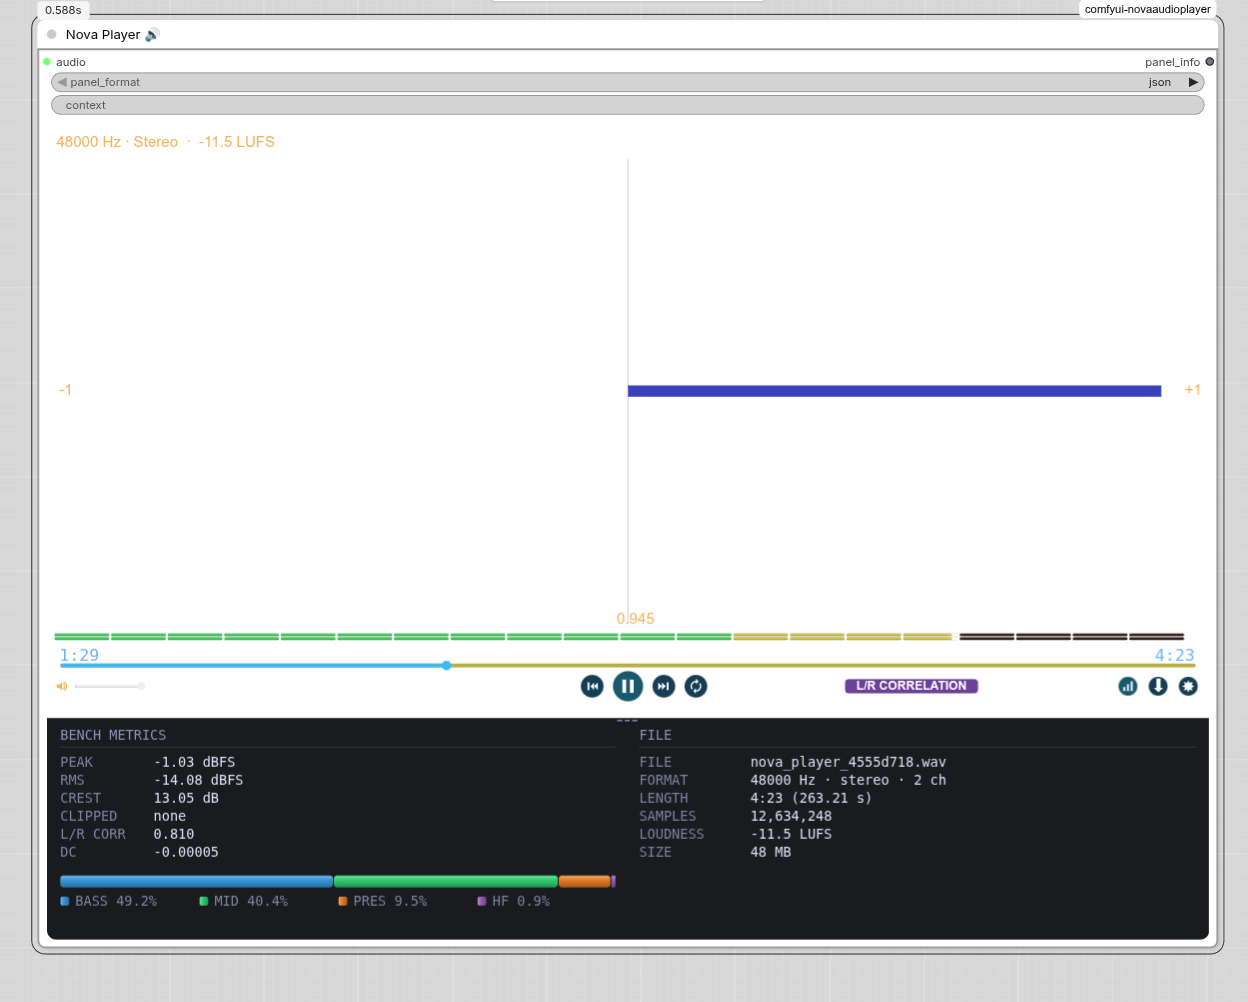 |
| Freq % | Energy split across four contiguous bands |
|
| Freq % | Energy split across four contiguous bands | 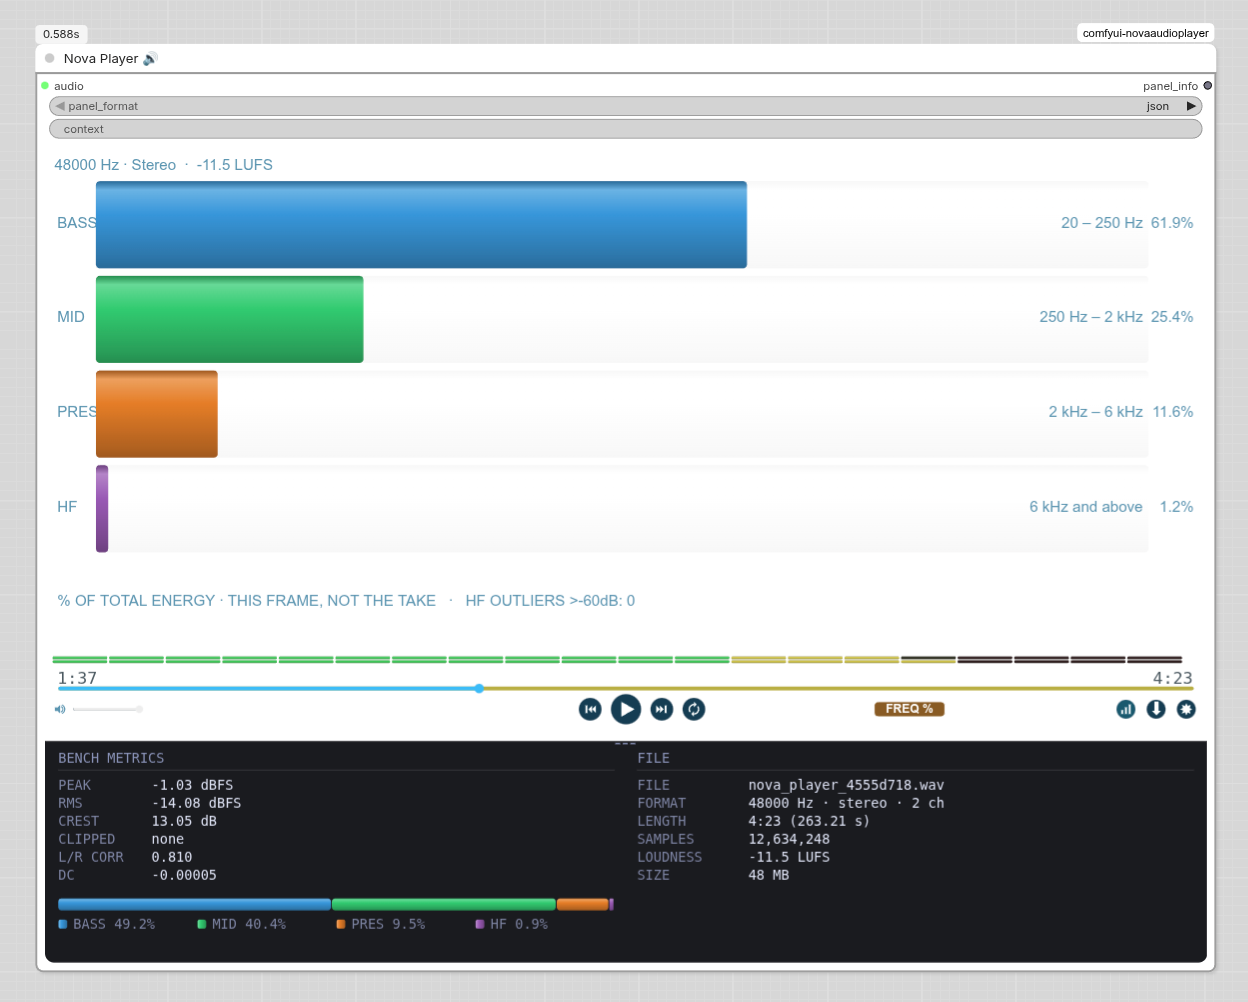 |
| Combined Suite | Meters, correlation and bands in one view |
|
| Combined Suite | Meters, correlation and bands in one view | 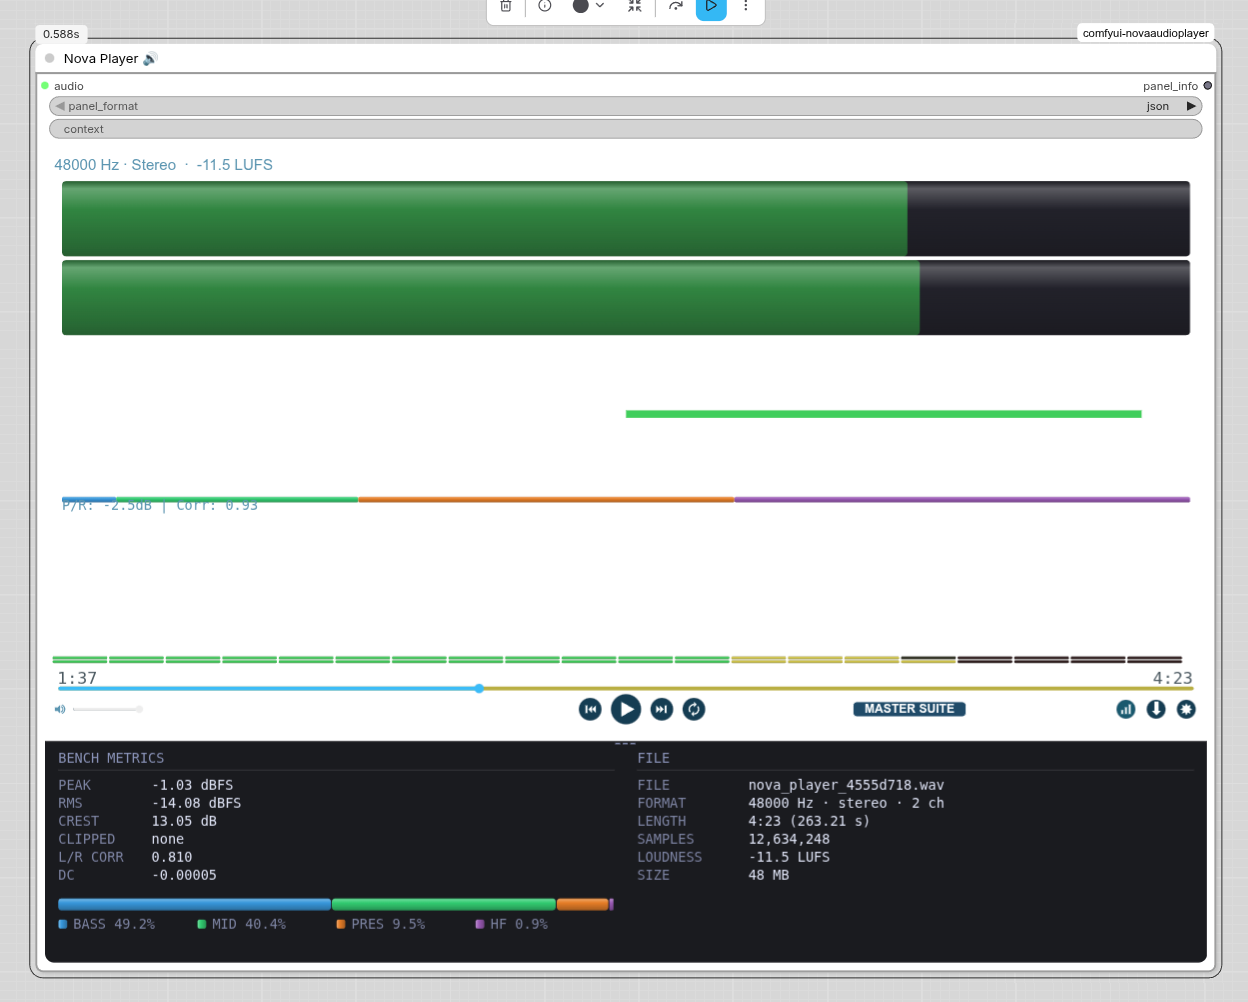 |
| FFT Analyzer | High-resolution spectrum with peak hold |
|
| FFT Analyzer | High-resolution spectrum with peak hold | 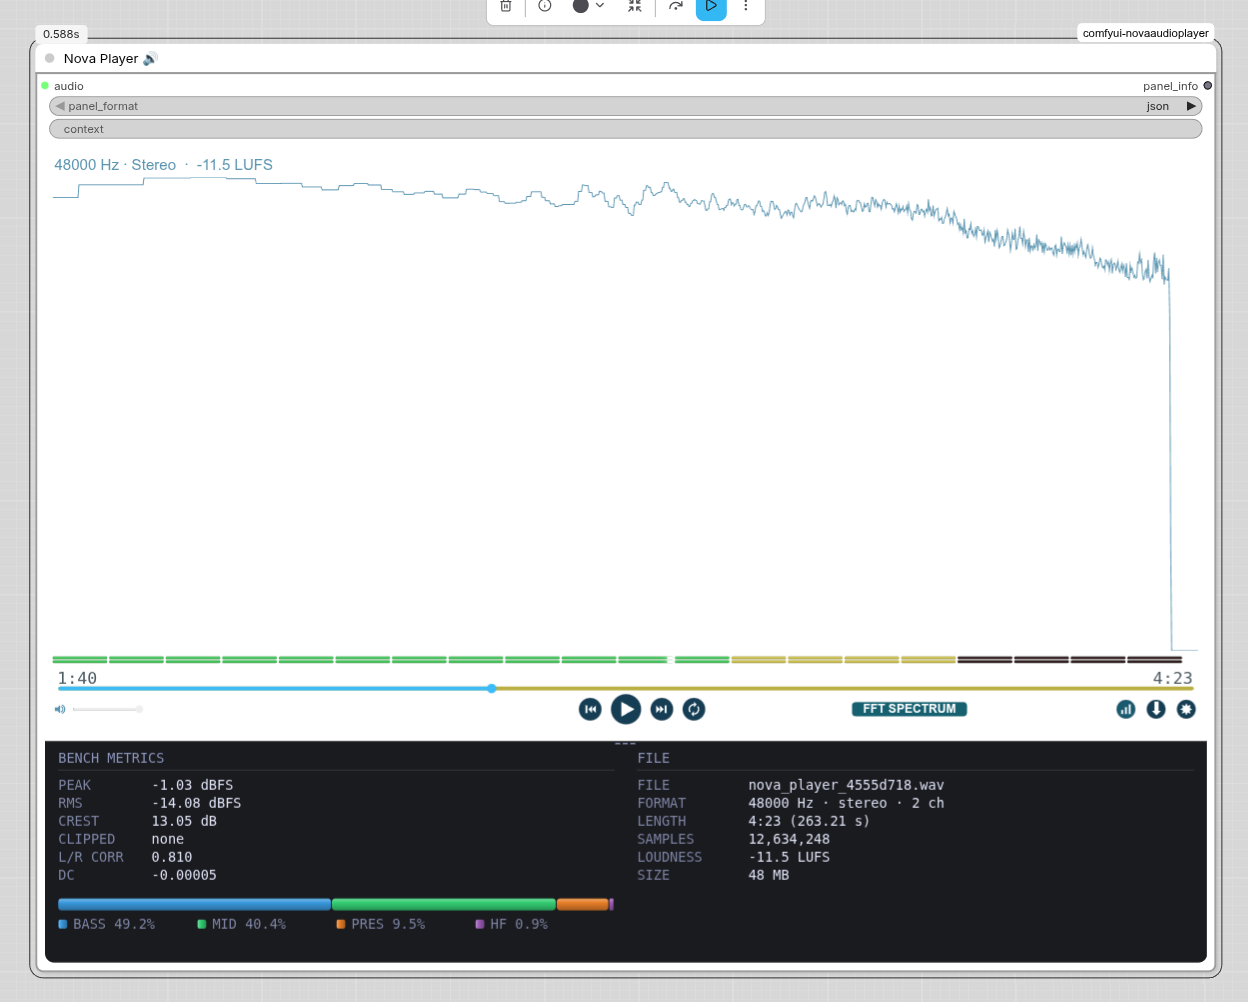 |
| RTA Analyzer | 1/3-octave real-time analyser |
|
| RTA Analyzer | 1/3-octave real-time analyser | 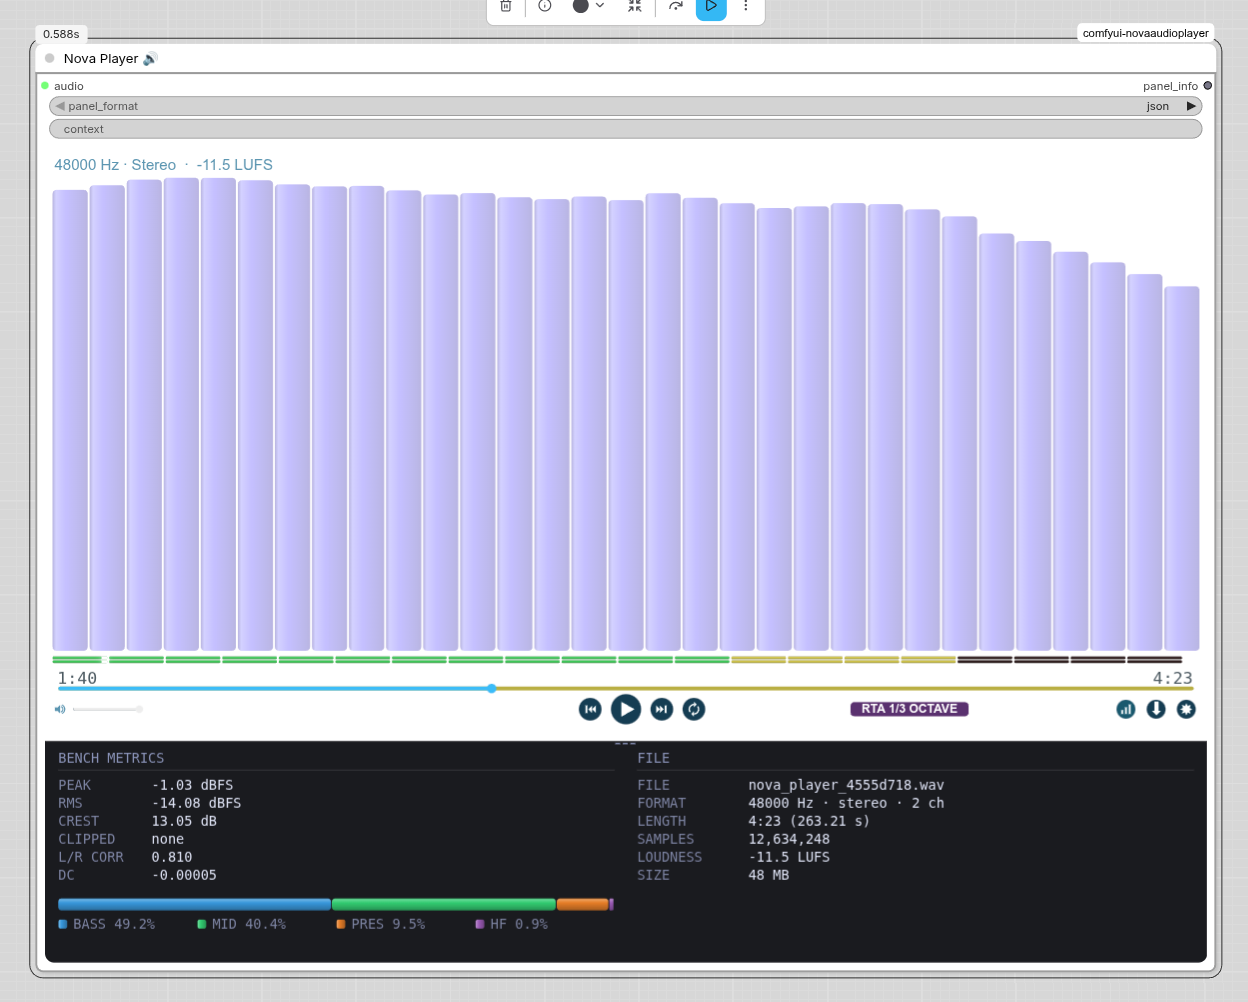 |
| APG Meter | Artifact metrics for tuning generation settings |
|
| APG Meter | Artifact metrics for tuning generation settings | 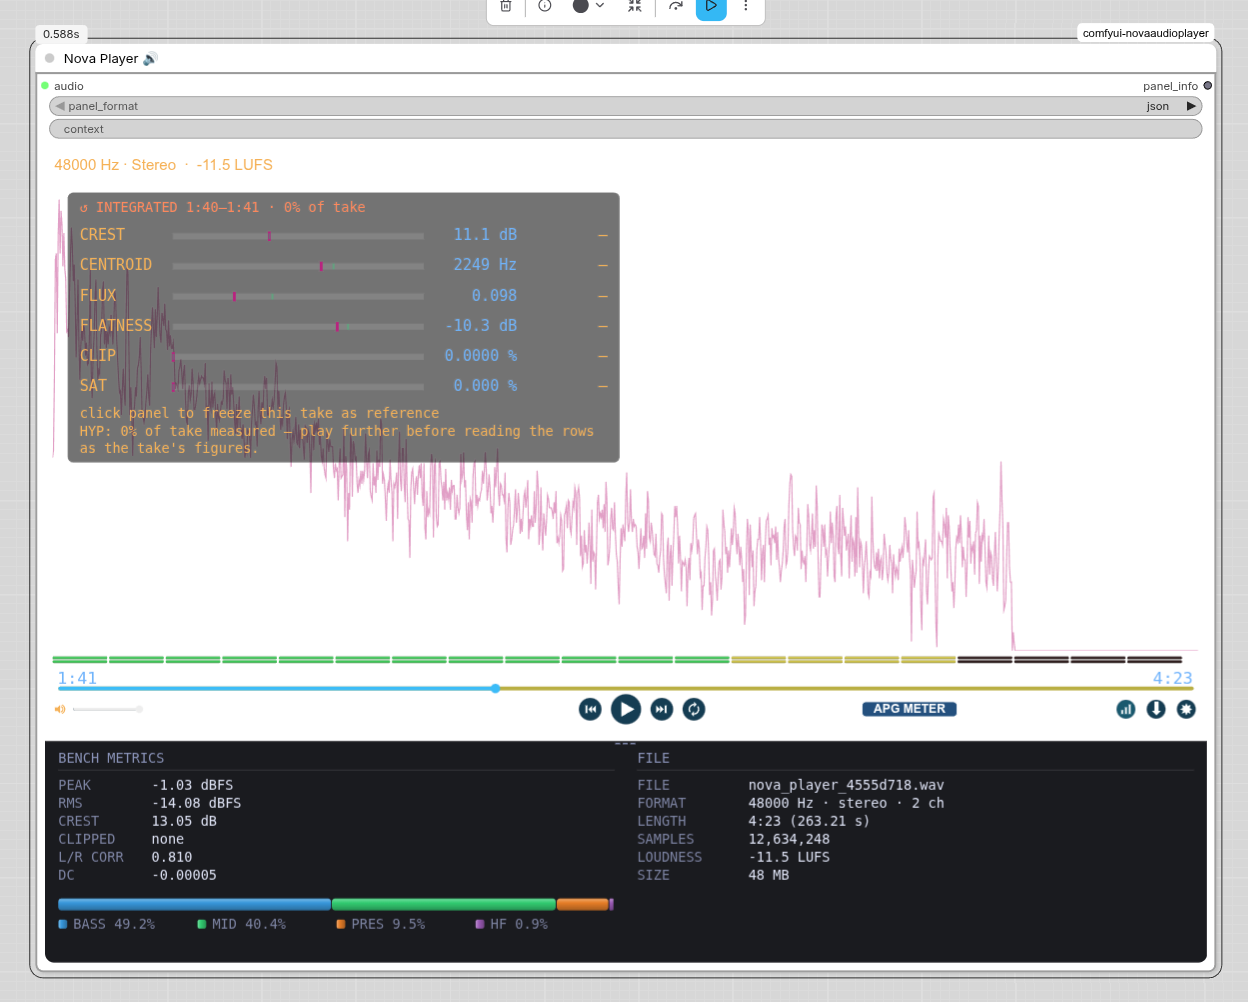 |
| Halo | Decorative burst ring with drifting bubbles — display only, not a measurement |
|
| Halo | Decorative burst ring with drifting bubbles — display only, not a measurement | 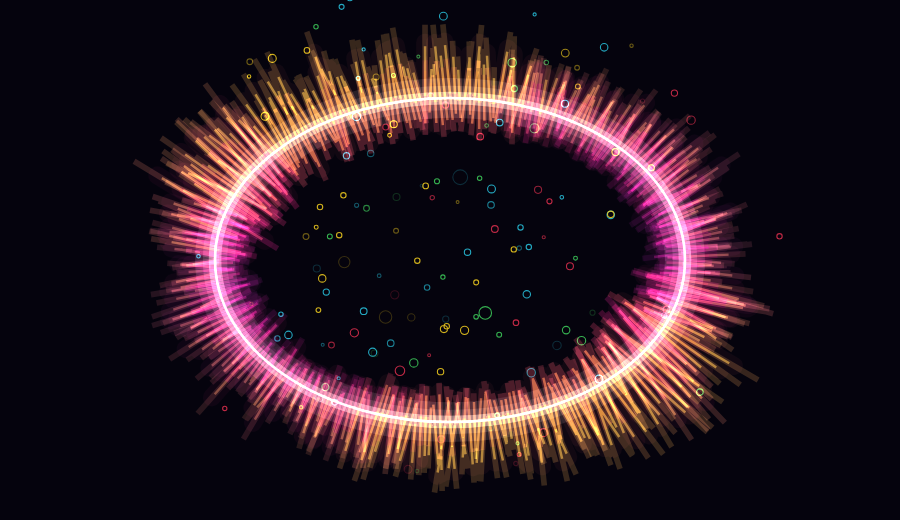 |
|
Loudness, measured properly
The loudness badge is ITU-R BS.1770-4 integrated LUFS: K-weighted, summed across channels rather than averaged, and gated at −70 LUFS absolute and −10 LU relative.
That is worth stating plainly because an earlier version got it wrong. It
averaged L and R into mono before measuring — a different quantity, 3 dB low for
correlated stereo — and it took the mean square of the whole file instead of
gating. Together those read 3.84 LU low on the take they were found with:
−17.3 LUFS where ffmpeg's ebur128 reports −13.5. A number that wrong is worse
than no number, because it is the one a mastering decision gets made against.
The current implementation tracks ffmpeg to within 0.05 LU across the test
suite. If scipy is unavailable the channel rule still holds, but the figure is
unweighted and ungated — close, not correct.
An output you can log
The node returns panel_info — everything in the bench strip as a string,
ready for a display node or a database. The panel_format widget picks the
shape: json for a parser, text for reading, csv_row for appending to a
log. It is built from the same numbers the panel draws, so a logged take and the
screen can never disagree.
It works before you wire anything
Place the node and it is already a player — chrome, transport, view pill, and a
visualiser animating a synthetic signal so you can see what each view does. The
badge row says no audio connected · press play for a demo; pressing play runs
a four-second clip through the real analyser, so the first thing you see is a
genuine measurement rather than a mock-up.
Connect an AUDIO output and all of it is gone for good. Nothing is fetched or
played until you ask for it.
Downloads
The download arrow offers WAV, FLAC and OGG — everything
soundfile can write, with no external binary involved.
There is deliberately no MP3, M4A, Opus or WebM, and there will not be.
This node measures. Its own SAT row reads 0.0000% on a 320k MP3 — the figure
does not fail, it quietly stops meaning anything — so a lossy download from the
measurement node would be a file its own panel cannot honestly read. Delivery
formats also have their own home: Nova Save Audio FLAC 24/16-bit and Nova Save Audio
WAV PCM16|PCM24|FLOAT32 under Delivery & Metadata. The download arrow is for
auditioning what you are measuring, not for shipping it.
If you want an mp3, the WAV is one ffmpeg command away.
A bench panel that agrees with itself
Click the bar-chart button next to the download arrow. Everything in the strip is measured once, in Python, from the same audio the waveform and the loudness badge come from — so nothing on screen can disagree with anything else on screen.
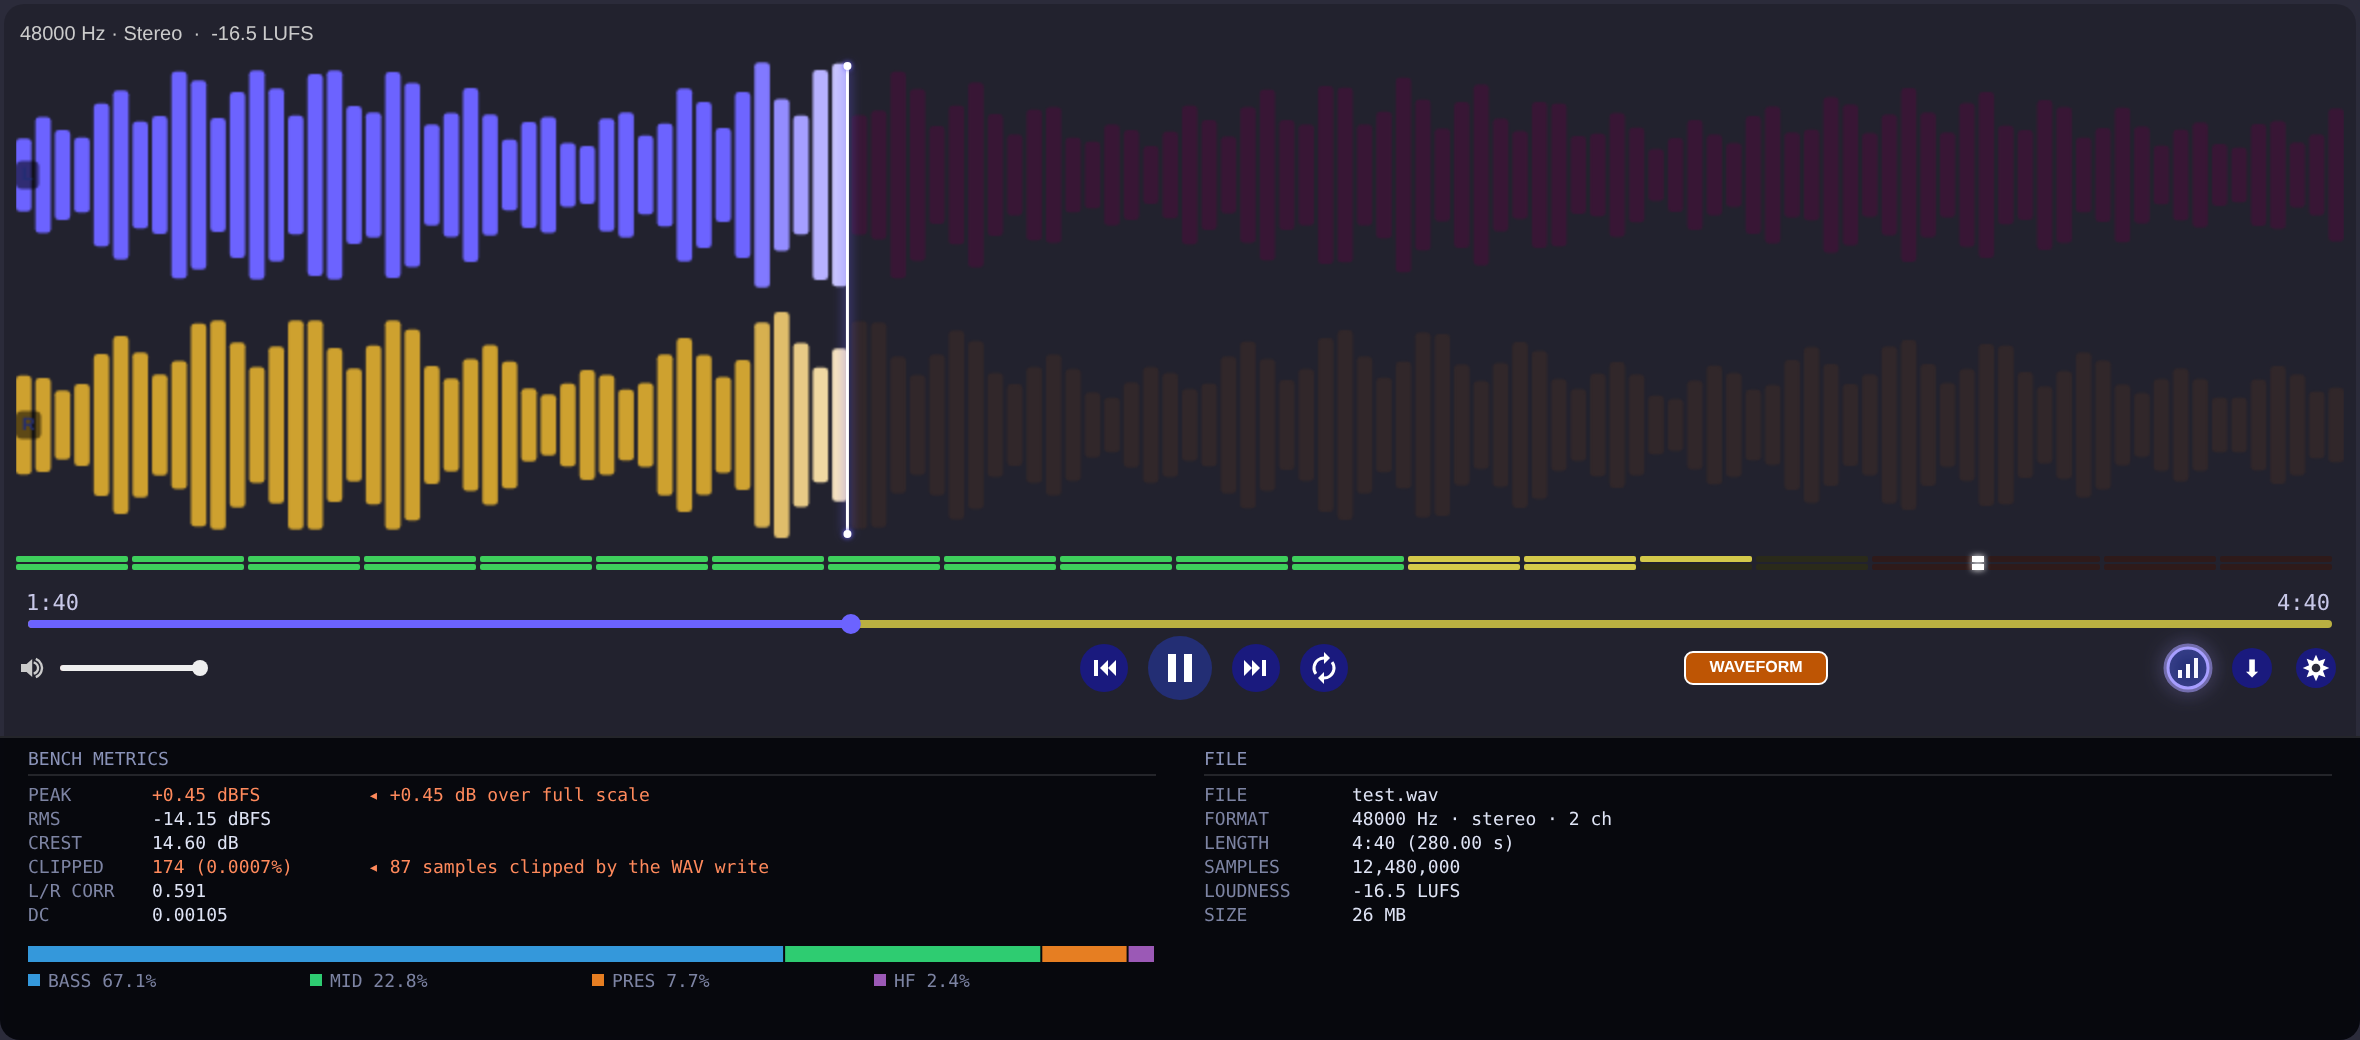
It reports the peak before the WAV write clamps it, so a generation that overshoots full scale tells you so instead of silently arriving pre-clipped. Band shares are contiguous and always total 100%.
Drag its top edge to make it taller.
The APG meter
Six artifact metrics — crest, spectral centroid, flux, flatness, clipping and flat-top saturation — each shown live and integrated over the whole take.
Click the panel to freeze a reference take. Every row then shows a delta against it, so you can change one generation setting, render again, and read which way the audio moved. There is a directional hint line, and it is clearly marked as a hypothesis rather than a measurement.
Full explanation of what each metric means and where the numbers came from →
Themes, and a settings drawer that stays out of your way
Click the gear. You get colours for the view you are currently looking at, that view's own settings, and the shared player chrome — not a wall of every colour in the node.
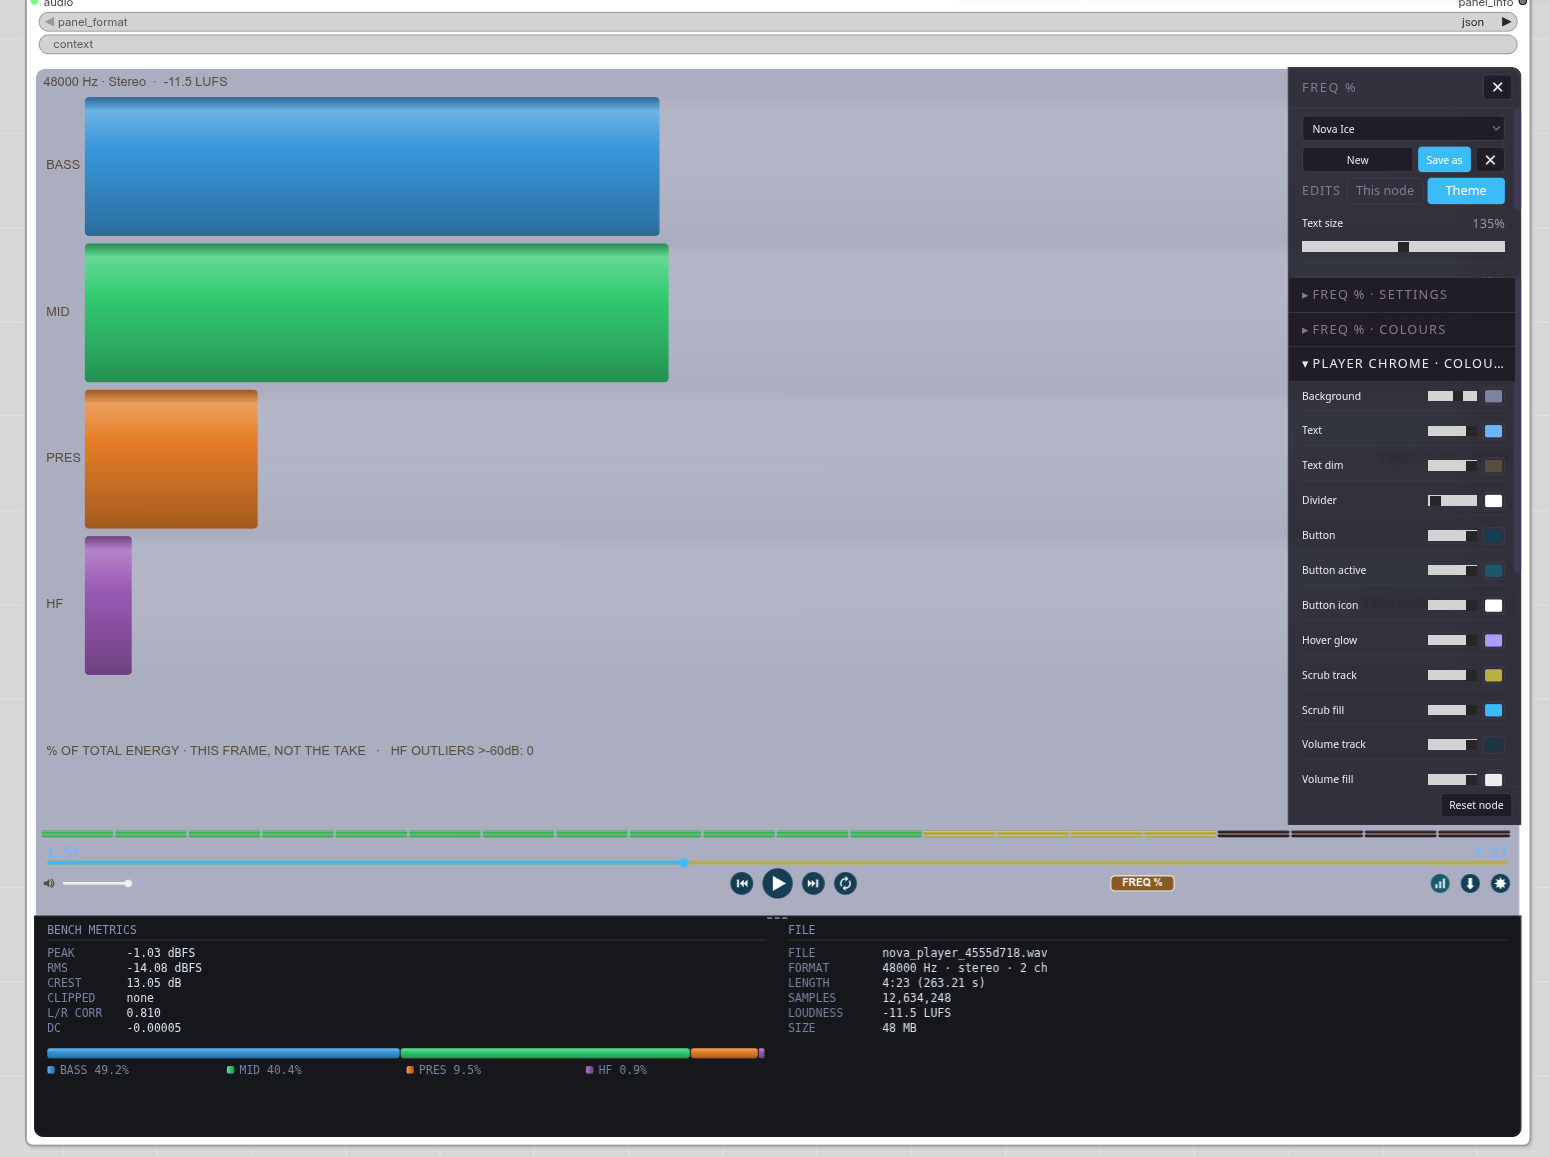
Everything autosaves. The only save button is for themes.
Edits: This node / Theme. Colour changes can stay with this one player (saved in your workflow) or be written to the theme on disk for every player using it. There is a button to promote node changes to the theme when you like what you have.
Text size and bar relief sliders live with the theme controls. Both are display preferences rather than theme content, so switching theme does not change them.
Sequences: record a show, then sit back
Some views are made to be watched rather than read. Halo is the first. These views have a Sequences section in the drawer that works like recording a macro:
- Click ● Record new… and type a name, for example Spinning Fury Master.
- Click Start, then play with the settings: speeds, tilt, sizes, whatever you like. Colour changes are not recorded. The pauses between changes are recorded too. The recording clock follows the song, so if you need to think, pause the music: time spent paused isn't recorded, and you won't come back to long dead gaps.
- Click ■ Stop & save. The sequence is saved under the name you chose and appears in the list.
Pick one from the list and click ▶ Play. It plays once, a number of times, or in a loop, with the same timing you used while the music plays. Your own settings are never touched: when the sequence stops, the view is exactly as you left it. Changing any setting yourself during playback hands control back to you.
The files live in ComfyUI/user/nova_player/sequences/<view>/, one plain
JSON file per sequence and one folder per view. Back the folder up, share
sequences, or drop other people's into it. The list re-reads the folder every
time you choose the view. A file made for a different view or an older version
still plays: any setting it names that this view does not have, or whose value
is the wrong type or out of range, is skipped, and the rest plays through to the
end. 🗑 deletes a sequence after an "Are you sure?".
Measurement views deliberately do not have this: a meter whose settings change by themselves is a meter you cannot trust.
Renderers, themes and tested versions
Tested on ComfyUI 0.37.0 with frontend 1.53.6. Older versions are not tested, so no minimum is claimed.
The pack works with both of ComfyUI's node renderers, Nodes 2.0 and Classic. A few things differ between them:
- The mouse wheel inside a panel (Nodes 2.0). ComfyUI sends the wheel to the canvas unless a panel has been clicked. Click once inside a report, the FlowPulse dashboard, a SQLite grid or Theme Studio, and the wheel scrolls or zooms that panel. Click outside the node and the wheel zooms the canvas again. In Classic the wheel works on hover.
- Minimum sizes. Nodes with a panel of their own cannot be dragged smaller than the panel needs, in either renderer.
- Report export. Right-click a report viewer and choose Export views → images. In Nodes 2.0 a line above the report says so; in Classic the same hint is in the title bar.
- Folding (Nodes 2.0 only). With Theme Studio's Top panel set to Collapsible, a button in a node's title bar folds the slots and standard widgets away and gives the room to the node's own panel.
Nova Theme Studio changes the look of everything, not only this pack's nodes, and keeps doing so on every page load until you switch it off. Set its Enabled / Disabled switch to Disabled to get ComfyUI's own look back; your theme is kept for when you enable it again. The pack sets no colours on its own nodes: without Theme Studio they look like any other node.
Tips
- Working on a 1440p or 4K display? Turn up Text size in the settings drawer. The defaults were chosen against 1080p.
- Bars look flat? Bar relief controls the 3D shading. The lighting is derived from each bar's own colour, so it works with any theme you make.
- Want the SAT metric to mean anything? Point the player at FLAC output, not MP3. Lossy encoding smooths away the flat tops it detects.
- Comparing takes with the APG meter? Keep
fft_sizethe same between them. The bin count shifts flatness and centroid. - Dropping a link opens the search box, not the Nova suggestions? Set
Settings > LiteGraph > LinkRelease > Action on link release to context
menu, or hold Shift as you drop. See Install. If you stay
with the search box, type
novain it. Do not rely on the ▶️ Nova Audio category on the left: after dropping a text link it can show "No Results", because ComfyUI lists only the first 64 matching nodes before it applies the category. - Node too small? Opening the bench strip raises the minimum height. Drag the node bigger, or close the strip.
- Measuring loudness for a release? Check
scipyis installed. Without it the badge is approximate, and the node does not hide that.
Madow Inputs 🎚️
Every ACE-Step generation parameter in one place, with named presets and a
context output that carries the exact parameters into the player's
panel_info.
- 27 parameters, namespaced so the two
cfg-shaped parameters cannot collide —ksampler.cfgis the sampler's,text.cfg_scaleis the text encoder's. - Presets as one JSON file each under
presets/, so they are shareable, git-trackable and hand-editable. Loading one writes the real widgets; the backend never substitutes values, or the saved workflow would record a preset name without recording what actually ran. - ACE-Step's own domains for
timesignature,languageandkeyscale. Those three are combo inputs onACEStep15XLTextEncode, so they are combo widgets here too, with the option lists read from that node when it is installed. Typed as plain strings they would not connect to it, and the values a human writes —4,english, an empty key — are not values it accepts. Presets written before this are migrated on load (4→"4",english→en) and anything unreadable falls back to the default with a note rather than silently. - Cross-field validation, warn-only. A caption saying
98 BPMagainst a bpm widget of 122 is a live conflict ACE-Step reads both sides of. contextcarries both a seed-excluded and a seed-included hash: the first groups runs that differ only by seed, which is the seed-noise-floor question.- Output naming:
file_prefix,file_name,file_folderandfile_separatorare outputs in their own right, plus a derivedfile_paththat assembles them asfolder/prefix<separator>name. Empty fields collapse, so nothing carries a dangling separator or a leading slash. The naming fields are saved in presets but excluded from both hashes — renaming a file does not change the audio, and hashing it would split two identical renders into different groups.
Two nodes, on purpose
Madow Inputs holds the widgets and emits four slots: madow, file_path,
context, validation. Madow Unpack ⚪ takes the madow bundle and fans it
out into 28 typed outputs — the 27 parameters plus file_path.
The split falls where the data stops being interdependent — the hashes,
preset_dirty, validation and context all need every parameter at once, so
they stay with the widgets that produce them and nothing has to be merged back.
Two things it buys: the fan-out is optional, so wiring a couple of parameters by hand means not placing Unpack at all; and it is repeatable, so you can put one beside KSampler and another beside the text encoder rather than running twenty wires across the graph.
Wire context into the player's optional context input and every measured
take records what produced it.
Workflows and LoRAs
Seven ready-to-run workflows live in example_workflows/,
grouped the same way the node menu is. Each one ships twice: a .json and a
.png template — drag either onto the canvas and it loads.
| Group | Workflow | Needs models? | |---|---|---| | Generation & Synthesis | Ace-Step XL SFT — Prompt and Lyrics to Audio | ACE-Step 1.5 | | | Ace-Step XL SFT — Prompt and Lyrics to Audio Using Lora | ACE-Step 1.5 + the LoRA | | Mastering Process | Nova Audio Mastering Process | no | | | Nova Audio Master Comparison Validation | no | | Delivery & Metadata | Nova Audio Tag Reader | no | | | Nova Audio Tag Writer | no | | LoRA Training | Nova Ace-Step 1.5 LoRA Pre-Processor And Training | ACE-Step 1.5 |
Five of the seven need no models and no other custom node pack — install this and run them. The mastering chain is the one to start with: load a track, master it, read the report in the canvas, save it, then verify the saved file still reproduces the master you approved.
The Southern Blues Rock LoRA is published as a release asset rather than committed here — 80 MiB in the git history would be downloaded by everyone cloning the repository, forever. Direct download (80.1 MiB) →
Model downloads, install paths and the LoRA's checksum →
More workflows and LoRAs will be added over time.
Documentation
Per-node help is built in: right-click any node and choose Help.
| Document | What is in it | |---|---| | TECHNICAL.md | Architecture, the renderer contract, adding your own view, colour roles, HTTP endpoints, the analyser data trap, local development | | Design notes | Every significant decision, every bug found, and the reasoning behind each fix |
If you are here to add a visualiser, start with
TECHNICAL.md § Adding a view mode and
copy web/renderers/_template.js. Adding one is a new file plus two lines in
registry.js — the pill, its width, the cycle order, the minimum node size and
its settings-panel section all follow automatically.
Credits
Built by NovaFemme, with engineering assistance from Claude (Anthropic).
Licence
MIT © NovaFemme