
ComfyUI Extension: ComfyUI-Data-Analysis
Run ComfyUI workflows without the setup
No installs, no CUDA version roulette, no GPU sitting idle on your bill. Bring a workflow and run it in the browser.
Data analysis custom modules for ComfyUI - Use Pandas & Matplotlib from within ComfyUI
Looking for a different extension?
Custom Nodes (186)
- CDA Float Create
- CDA Int Create
- CDA JSON Create
- CDA Show Float
- CDA Show Int
- CDA String Create
- CDA Text Create
- MPL Bar Chart
- MPL Line Plot
- MPL Pie Chart
- MPL Scatter Plot
- Numpy Float Create
- Numpy Int Create
- Numpy Show
- Numpy Squeeze
- Pandas Add
- Pandas Add Scalar Float
- Pandas Add Scalar Int
- Pandas Add Series
- Pandas As Float
- Pandas As Int
- Pandas As String
- Pandas At Datetime
- Pandas At Float
- Pandas At Int
- Pandas At Set Datetime
- Pandas At Set Float
- Pandas At Set Int
- Pandas At Set String
- Pandas At String
- Pandas Boolean Index
- Pandas Columns
- Pandas Corr
- Pandas Cos
- Pandas Count
- Pandas Cov
- Pandas Create
- Pandas Create From Dict
- Pandas Create From Dict Index List
- Pandas Create From Multiple Dict
- Pandas Create From Numpy
- Pandas Create From Tensor
- Pandas Create Series From Dict
- Pandas Create Series From List
- Pandas Create Series From List Index List
- Pandas Create With Index
- Pandas Crosstab
- Pandas Cummax
- Pandas Cummin
- Pandas Cumprod
- Pandas Cumsum
- Pandas Div
- Pandas Div Scalar Float
- Pandas Div Scalar Int
- Pandas Div Series
- Pandas Drop Duplicates
- Pandas Drop NA
- Pandas Eq
- Pandas Eq Scalar Float
- Pandas Eq Scalar Int
- Pandas Excel File Sheet Names
- Pandas Exp
- Pandas Feature Split To Numpy
- Pandas Feature Split To Pt
- Pandas Fill NA Scalar Float
- Pandas Fill NA Scalar Int
- Pandas Ge
- Pandas Ge Scalar Float
- Pandas Ge Scalar Int
- Pandas Group By
- Pandas Gt
- Pandas Gt Scalar Float
- Pandas Gt Scalar Int
- Pandas Head
- Pandas Horizontal Concat
- Pandas Horizontal Split
- Pandas Iat Datetime
- Pandas Iat Float
- Pandas Iat Int
- Pandas Iat Set Datetime
- Pandas Iat Set Float
- Pandas Iat Set Int
- Pandas Iat Set String
- Pandas Iat String
- Pandas Iloc Rows DataFrame
- Pandas Iloc Row Series
- Pandas Iloc Rows Slice DataFrame
- Pandas Index
- Pandas Index To String
- Pandas Is NA
- Pandas Join
- Pandas Kurtosis
- Pandas Le
- Pandas Le Scalar Float
- Pandas Le Scalar Int
- Pandas Load CSV
- Pandas Load CSV With Encoding
- Pandas Load CSV With Index
- Pandas Load Excel
- Pandas Load HTML
- Pandas Load JSON
- Pandas Loc Cell String
- Pandas Loc Row MultiIndex DataFrame
- Pandas Loc Row Series
- Pandas Log
- Pandas Lt
- Pandas Lt Scalar Float
- Pandas Lt Scalar Int
- Pandas Max
- Pandas Mean
- Pandas Median
- Pandas Melt
- Pandas Min
- Pandas Mode
- Pandas Mul
- Pandas Mul Scalar Float
- Pandas Mul Scalar Int
- Pandas Mul Series
- Pandas Ne
- Pandas Ne Scalar Float
- Pandas Ne Scalar Int
- Pandas Pivot
- Pandas Pow
- Pandas Pow Scalar Float
- Pandas Pow Scalar Int
- Pandas Pow Series
- Pandas Rename
- Pandas Rename Advanced
- Pandas Replace
- Pandas Replace Advanced
- Pandas Save CSV
- Pandas Save JSON
- Pandas Select Column As Series
- Pandas Select Columns
- Pandas Select Rows
- Pandas Series To DataFrame
- Pandas Series To String
- Pandas Set Index
- Pandas Show DataFrame
- Pandas Show Index
- Pandas Show Series
- Pandas Show Text
- Pandas Sin
- Pandas Skew
- Pandas Sort
- Pandas Std
- Pandas Strftime
- Pandas Sub
- Pandas Sub Scalar Float
- Pandas Sub Scalar Int
- Pandas Sub Series
- Pandas Sum
- Pandas Summary
- Pandas Tan
- Pandas To Datetime
- Pandas To Numpy
- Pandas To String
- Pandas Transpose
- Pandas Value Counts
- Pandas Var
- Pandas Vertical Concat
- Pandas Vertical Split
- Pandas Xs
- Py Datetime To String
- Py Float To String
- Py Int To String
- Py Kv Float Create
- Py Kv Int Create
- Py Kv String Create
- Py List To String
- Py String To Datetime
- Py String To Dict
- Py String To Float
- Py String To Int
- Py String To List
- SNS Bar Chart
- SNS Bar Chart Pt
- SNS Boxplot
- SNS Heatmap
- SNS Histogram
- SNS Histogram Pt
- SNS Line Plot
- SNS Line Plot Pt
- SNS Pairplot
- SNS Scatter Plot
- SNS Scatter Plot Pt
README
ComfyUI-Data-Analysis
Update (March 10, 2025)
All PyTorch nodes have been moved to a separate extension. If you're using PyTorch wrappers, install the ComfyUI-Pt-Wrapper extension.

How Can We Figure Out Which MLB Player Had the Most Hits Per Year?
If you love ComfyUI, it's likely because of its incredible flexibility—allowing you to customize workflows to achieve exactly the results you want, primarily in image generation.
ComfyUI was designed to make Stable Diffusion accessible to non-engineers while offering extensive customization. However, it doesn’t natively support structured data like baseball statistics. That’s why I created this ComfyUI extension—to bridge that gap.
At the end of this page, you’ll find a tutorial on how to use this package to answer the MLB hits question.
I hope you find it useful and engaging for data exploration.
— Hide Inada
<hr>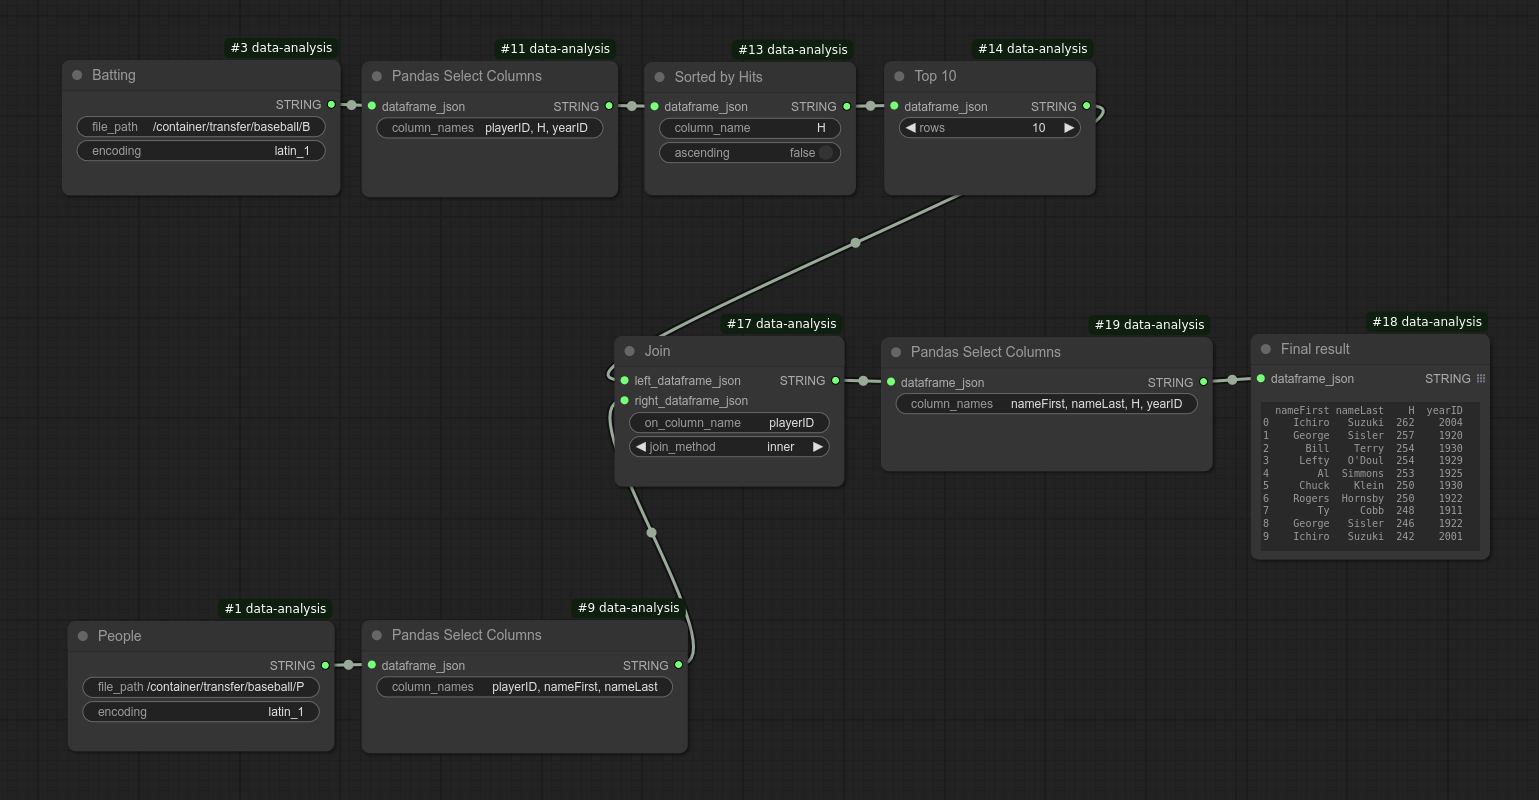 ComfyUI-Data-Analysis is an extension for ComfyUI that provides custom nodes for data analysis using Pandas, Seaborn, and Matplotlib within ComfyUI.
Especially, this is suited if you want to analyze structural data (tabular data) using ComfyUI's node system.
ComfyUI-Data-Analysis is an extension for ComfyUI that provides custom nodes for data analysis using Pandas, Seaborn, and Matplotlib within ComfyUI.
Especially, this is suited if you want to analyze structural data (tabular data) using ComfyUI's node system.
Features
ComfyUI-Data-Analysis includes numerous custom nodes that wrap Pandas, Matplotlib and Seaborn. For a complete list, see the Node Reference.
These nodes allow you to conduct complex analyses in an intuitive, graphical way. You can also combine them with other ComfyUI custom nodes to fit your workflow needs (e.g., integrating images).
Visualization & Analysis
These custom nodes enhance efficiency and usability in data exploration and visualization. Creating sample data and plotting it is incredibly simple:
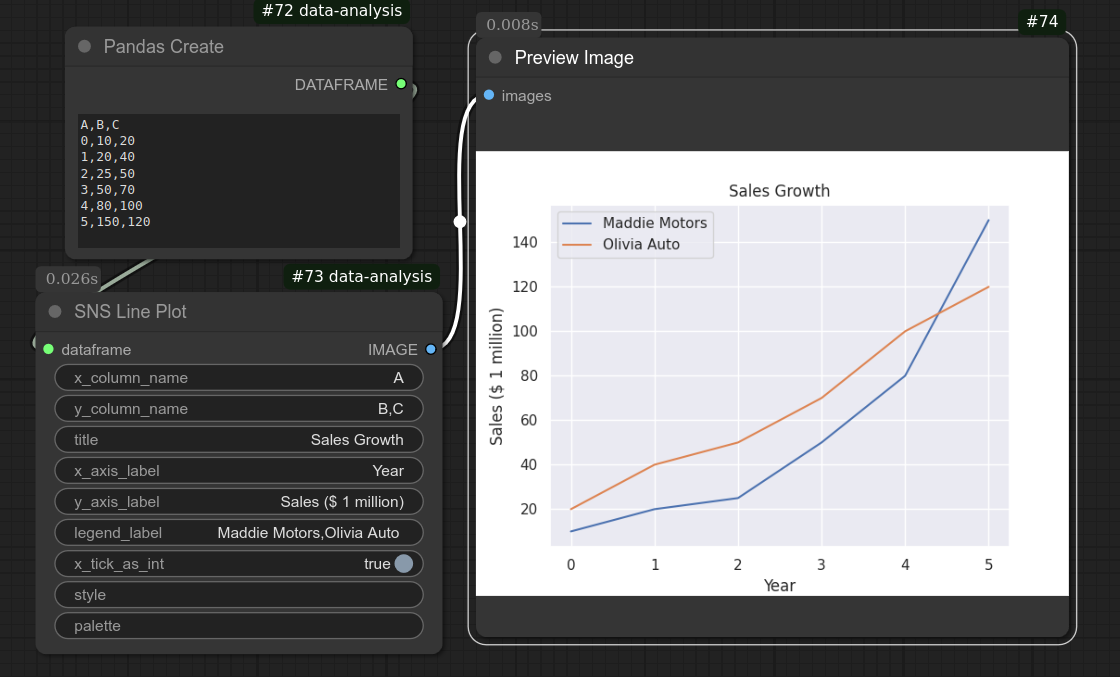
Example plot
Additionally, you can analyze images generated in ComfyUI’s workflows. Below is an example of a histogram showing the red channel pixel distribution (Note that you will also need a companion extension ComfyUI-Pt-Wrapper extension to access PyTorch tensors as shown in below screenshot):
![]()
Installation
Note: GPU is not required to run this custom module.
Installation via ComfyUI Manager
- Press Manager button on the top menu bar to display ComfyUI Manager Menu.
- Click Custom Node Manager.
- In the search field, enter Data analysis.
- "ComfyUI-Data-Analysis" should be displayed. Select Install.
- Restart ComfyUI.
- Reload browser page.
Installation via git
-
Navigate to the
custom_nodesdirectory within your ComfyUI installation. -
Run the following command:
git clone https://github.com/HowToSD/ComfyUI-Data-Analysis.gitThis will create a new subdirectory ComfyUI-Data-Analysis.
-
Rename the folder name from ComfyUI-Data-Analysis to data-analysis. Skipping this step will cause example workflows to fail, as they rely on this folder name.
-
Check if your ComfyUI environment already has required packages listed in requirements.txt. If not, install them using pip.
pip install -r requirements.txtRefer to requirements.txt for the right versions.
-
Start ComfyUI.
Troubleshooting for installation
This custom node module requires pandas and matplotlib, which are not included in the default ComfyUI installation. If you install this module using ComfyUI Manager, these packages should be installed automatically. However, if installation fails, refer to the pandas and matplotlib documentation for manual installation.
How to Use
Refer to User's Guide or check out Node Reference
For a practical example, see the tutorial on baseball data: How to Find Out Who Had the Most Hits.
Update
Refer to the release notes. While backward-incompatible changes are minimized, some may be necessary. The release notes contain those changes so that you know what to expect before upgrading your version.
Contribution
🚫 This project does not accept pull requests.
Unsolicited PRs will be closed without review.
If you have a feature request or improvement suggestion, please create an Issue instead.
All submitted issues will be reviewed and prioritized accordingly.
Note
The cover baseball image was generated using FLUX.1-dev. Commercial use of this image is not permitted.
Run ComfyUI workflows without the setup
No installs, no CUDA version roulette, no GPU sitting idle on your bill. Bring a workflow and run it in the browser.